Ethereum found support near the $158 area and climbed around 5%, just like bitcoin. However, ETH price is facing a strong resistance near $170, above which it could continue higher.After forming a support base near the $158 level, Ethereum recovered above $162 against the US Dollar.The price is up more than 5% and it broke the $165 resistance area.There was a break above a key bearish trend line with resistance near $161 on the hourly chart of ETH/USD (data feed via Kraken).The bulls need to gain strength above $170 for more upsides in the near term.Ethereum Price Approaching ResistanceRecently, there was a strong recovery in both bitcoin and Ethereum from $158 and $8,200 against the US Dollar. ETH price was able to climb above the key $162 resistance and the 100 hourly simple moving average to move into a positive zone.During the rise, there was a break above a key bearish trend line with resistance near $161 on the hourly chart of ETH/USD. More importantly, the bulls were able to push the price above the $165 resistance area.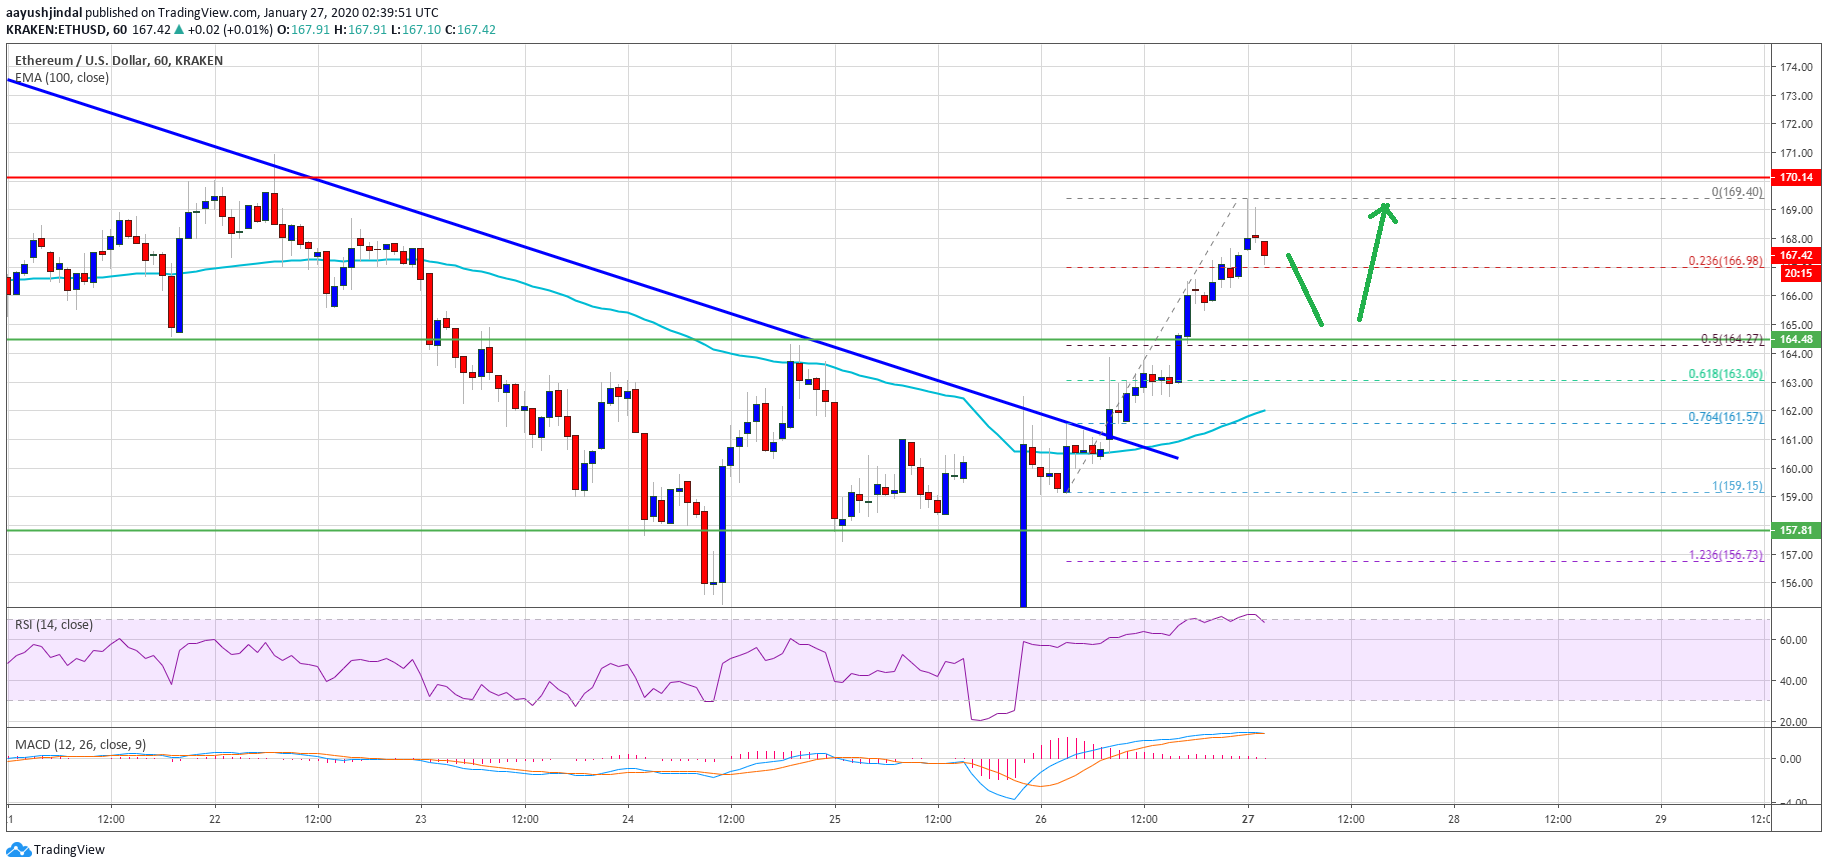 Ethereum PriceEthereum price climbed around 5% and it traded close to the key $170 resistance area. The previous rejection area near $170 might continue to play an important factor for a larger upward move.If there is a clear break above the $170 resistance, the price is likely to continue higher towards the $180 resistance. Any further gains could start a larger upward move towards the $200 resistance area. An intermediate resistance area is near the $188 level and the $190 pivot level.What If ETH Tops Near $170There are high chances that ETH price could struggle to continue above $170. In the mentioned case, the price may perhaps decline below the 23.6% Fib retracement level of the recent rise from the $159 swing low to $169 high.The first major support on the downside is near the $165 level (the recent breakout zone). It also coincides with the 50% Fib retracement level of the recent rise from the $159 swing low to $169 high.If Ethereum fails to stay above the $165 support, it could revisit the $162 support area or the 100 hourly SMA. Below $162, the price is likely to resume its decline in the near term.Technical IndicatorsHourly MACD – The MACD for ETH/USD is slowly moving into the bearish zone.Hourly RSI – The RSI for ETH/USD is currently correcting lower from the 70 level.Major Support Level – $165Major Resistance Level – $170
Ethereum Watch
ETHEREUM and ICO TOKENS
