Ethereum is currently consolidating losses above the $190 zone against the US Dollar. ETH price is facing many hurdles on the upside such as $208, $212, and the 100 hourly SMA.Ethereum is not showing any major bullish signs above the $200 level against the US Dollar.The price is likely to struggle near the key $208 and $212 resistance levels.There is a short term contracting triangle forming with resistance near $205 on the hourly chart of ETH/USD (data feed via Kraken).Bitcoin price attempted a recovery above $8,000, but it failed to gain momentum.Ethereum Price Consolidating LossesAfter trading as low as $188, Ethereum started a minor upside correction against the US Dollar. ETH price traded above the $190 and $195 levels, but it remained well below the 100 hourly simple moving average.It seems like the price is consolidating losses above the $190 and $195 levels. On the upside, an initial resistance is seen near the $205 level. The 23.6% Fib retracement level of the key drop from the $252 high to $188 low is also near the $205 zone.More importantly, there is a short term contracting triangle forming with resistance near $205 on the hourly chart of ETH/USD. The first key resistance on the upside is near the $208 level (the recent breakdown zone).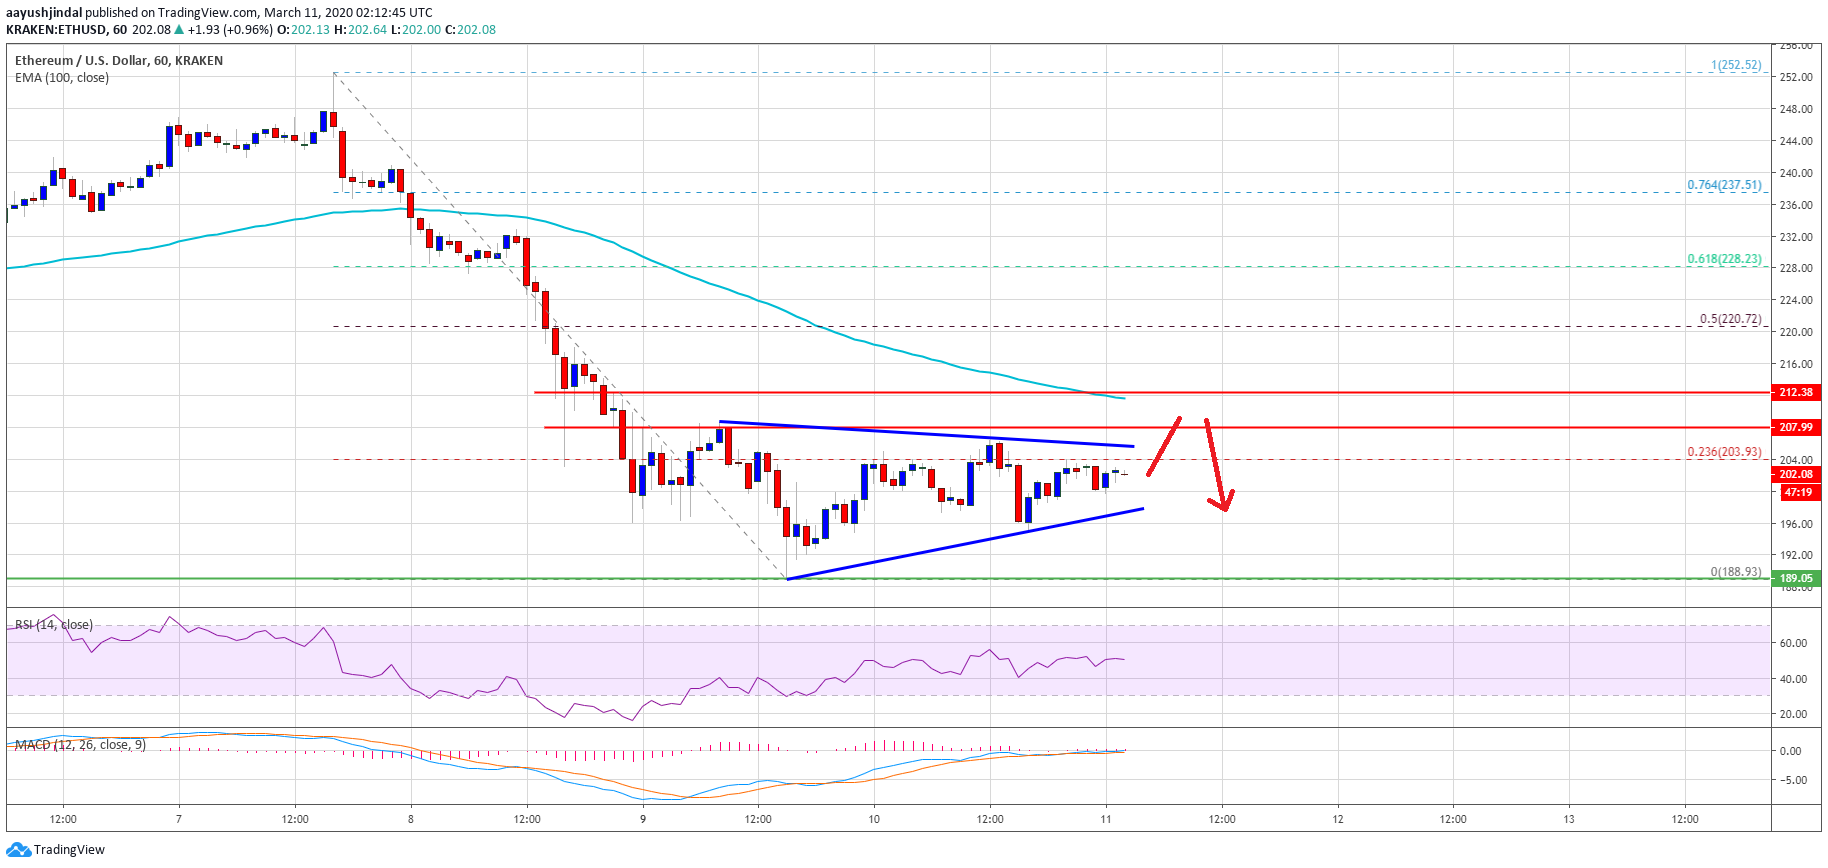 Ethereum PriceThe next hurdle is near the $212 level since it coincides with the 100 hourly simple moving average. If Ethereum price manages to climb above the $208 and $212 resistance levels, it might start a decent recovery.A successful break above the $212 resistance zone could lead the price towards the $220 resistance level in the near term. The 50% Fib retracement level of the key drop from the $252 high to $188 low is also near the $220 zone. Any further gains may perhaps push the price towards the $228 level.Fresh Decline?If Ethereum continues to face hurdles near the $205, $208 and $212 resistance levels, it is likely to resume its decline. A downside break below the triangle support and $195 might spark a fresh decline.An initial support is near the $190 and $188 levels. The main support is still near $185, below which there is a risk of a sharp decline towards the $165 level in the coming days.Technical IndicatorsHourly MACD – The MACD for ETH/USD is showing no major bullish signal.Hourly RSI – The RSI for ETH/USD is currently just below the 50 level, with a bearish angle.Major Support Level – $195Major Resistance Level – $212
Ethereum Watch
ETHEREUM and ICO TOKENS
