
Ethereum traded to a new monthly high near $249 before correcting lower against the US Dollar. ETH price is currently trading nicely above $253 and it could rally again towards $250.
- ETH price is holding the main $235 support level and the $232 pivot level against the US Dollar.
- It is facing a couple of important hurdles near $240 and $250.
- There is a crucial contracting triangle forming with resistance near $242 on the 4-hours chart of ETH/USD (data feed via Kraken).
- The pair could rally again above $245 as long as it is above the 100 simple moving average (4-hours).
Ethereum Price Holding Key Supports
This past week, Ethereum extended its rise above the $240 resistance against the US Dollar. ETH price traded close to the $250 resistance level and settled well above the 100 simple moving average (4-hours).
Ether traded as high as $249 and started a fresh downside correction (similar to bitcoin). There was a break below the $242 and $240 support levels, but the $235 support zone acted as a strong buy region.
The price is currently rising and trading above the 23.6% Fib retracement level of the downside correction from the $249 swing high to $235 low. It is currently facing a strong resistance near the $240-$242 region.
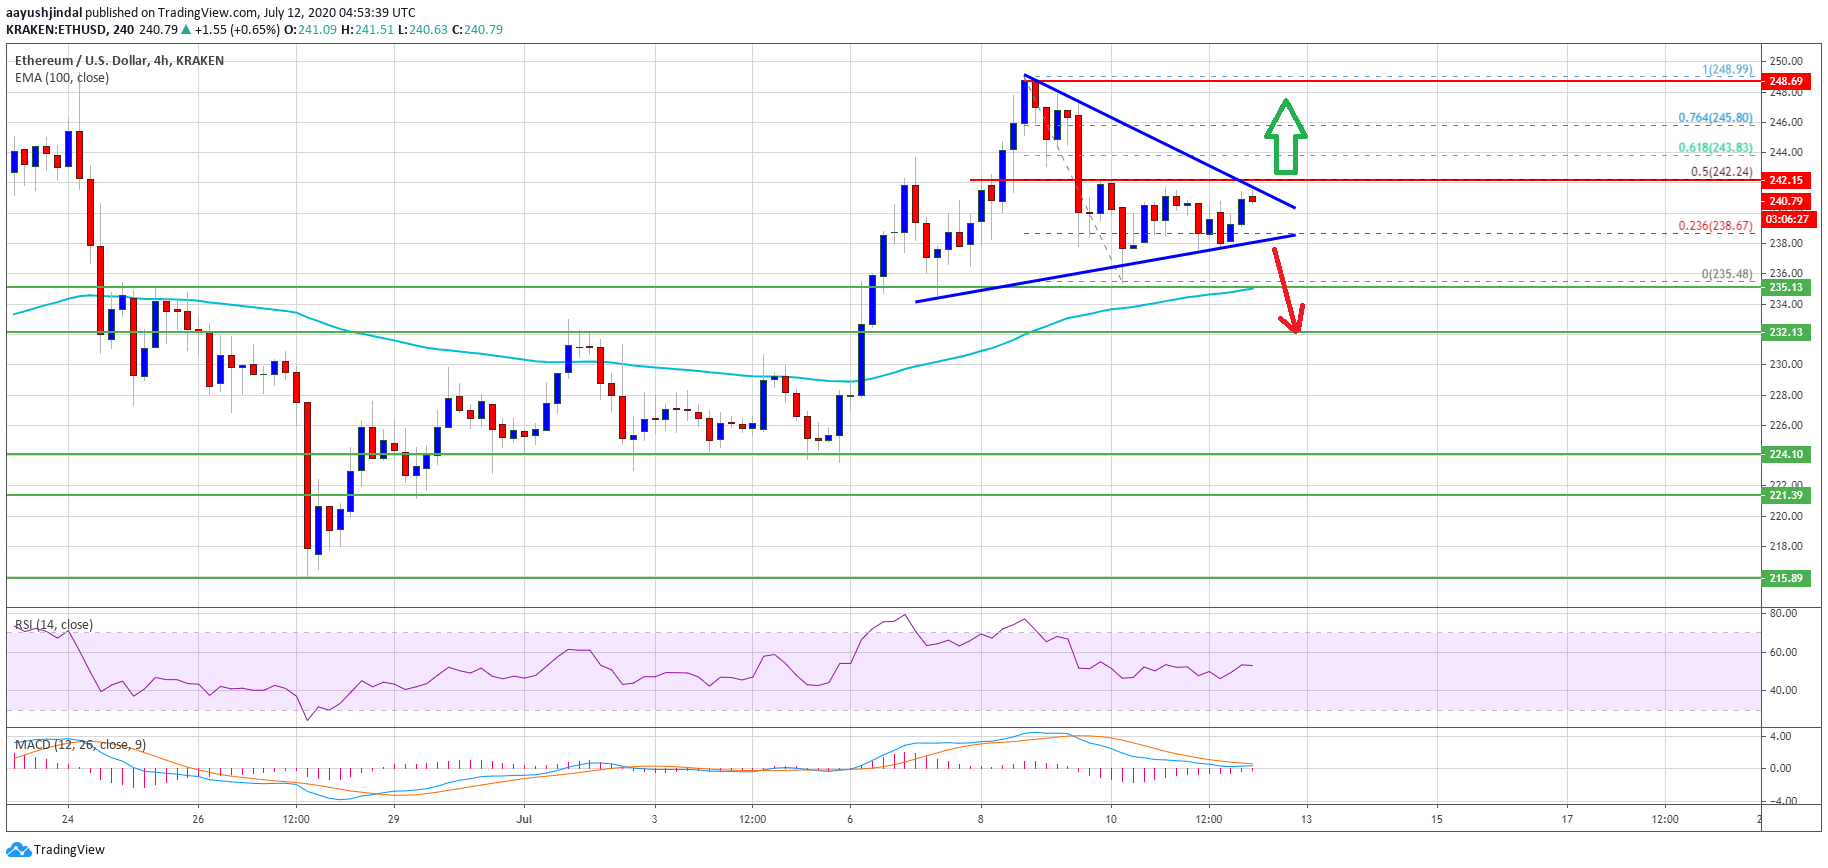
Ethereum price trades above $235. Source: TradingView.com
There is also a crucial contracting triangle forming with resistance near $242 on the 4-hours chart of ETH/USD. The triangle resistance coincides with the 50% Fib retracement level of the downside correction from the $249 swing high to $235 low.
If there is a successful break above the triangle resistance at $242, the price is likely to start a fresh increase. The main resistance on the upside is still near the $250 level, above which the price could start a strong rally towards $262 and $265.
Fresh Decline in ETH?
If Ethereum fails to continue higher above the $240 and $242 resistance levels, there are chances of a downside break. The first major support is near the triangle lower trend line at $238.
The mains support is near the $235 level and the 100 simple moving average (4-hours), below which the price could dive sharply towards the $$220 support area.
Technical Indicators
4 hours MACD – The MACD for ETH/USD is losing momentum in the bearish zone.
4 hours RSI – The RSI for ETH/USD is currently just above the 50 level.
Major Support Level – $235
Major Resistance Level – $242
Take advantage of the trading opportunities with Plus500
Risk disclaimer: 76.4% of retail CFD accounts lose money.