
Ethereum started a sharp downside correction below $2,400 and $2,300 against the US Dollar. ETH price is correcting losses, but it is likely to face sellers near $2,300.
- Ethereum declined heavily from well above $2,400 and tested the $2,000 zone.
- The price is now trading well below $2,300 and the 100 hourly simple moving average.
- There was a break above a key bearish trend line with resistance near $2,250 on the hourly chart of ETH/USD (data feed via Kraken).
- The pair is likely to face a strong resistance near $2,300 and $2,320.
Ethereum Price Is Correcting Losses
Ethereum formed a short-term top near the $2,550 level and started a major decline. ETH traded below many important supports near the $2,400 and $2,300.
The price even declined below the $2,200 support and settled well below the 100 hourly simple moving average, similar to bitcoin. It even spiked below the $2,000 support and traded as low as $1,951. Recently, ether started a decent recovery and climbed above the $2,100 and $2,200 levels.
There was a break above the 50% Fib retracement level of the downward move from the $2,496 swing high to $1,951 low. There was also a break above a key bearish trend line with resistance near $2,250 on the hourly chart of ETH/USD.
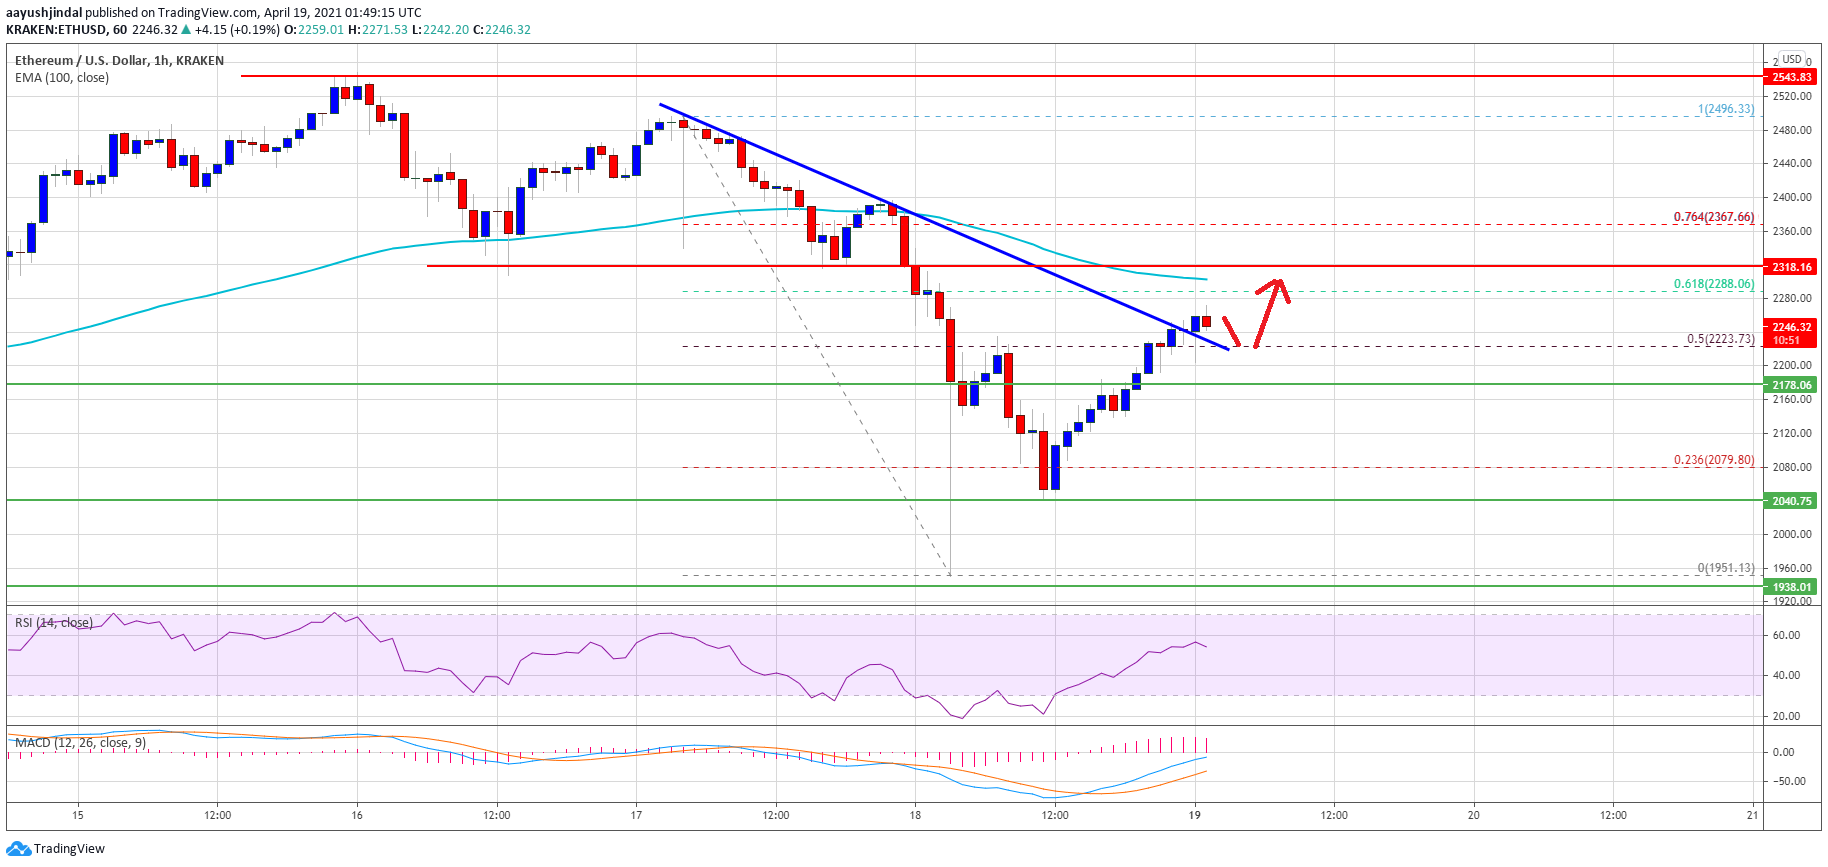
Source: ETHUSD on TradingView.com
The pair is now consolidating near the $2,250 level. On the upside, there is a major resistance forming near the $2,300 level and the 100 hourly simple moving average. The 61.8% Fib retracement level of the downward move from the $2,496 swing high to $1,951 low is also near $2,288.
A successful close above the $2,300 level and the 100 hourly SMA is must to move back into a positive zone. The next major resistance sits near $2,350.
Fresh Decline in ETH?
If Ethereum fails to clear the $2,300 level and the 100 hourly SMA, there is a risk of a fresh decline. An initial support on the downside is near the $2,200 level.
The next major support is near the $2,175 level. A successful downside break below the $2,175 support zone could open the doors for a move towards the $2,100 support in the coming sessions.
Technical Indicators
Hourly MACD – The MACD for ETH/USD is slowly gaining momentum in the bullish zone.
Hourly RSI – The RSI for ETH/USD is now back above the 50 level.
Major Support Level – $2,200
Major Resistance Level – $2,300