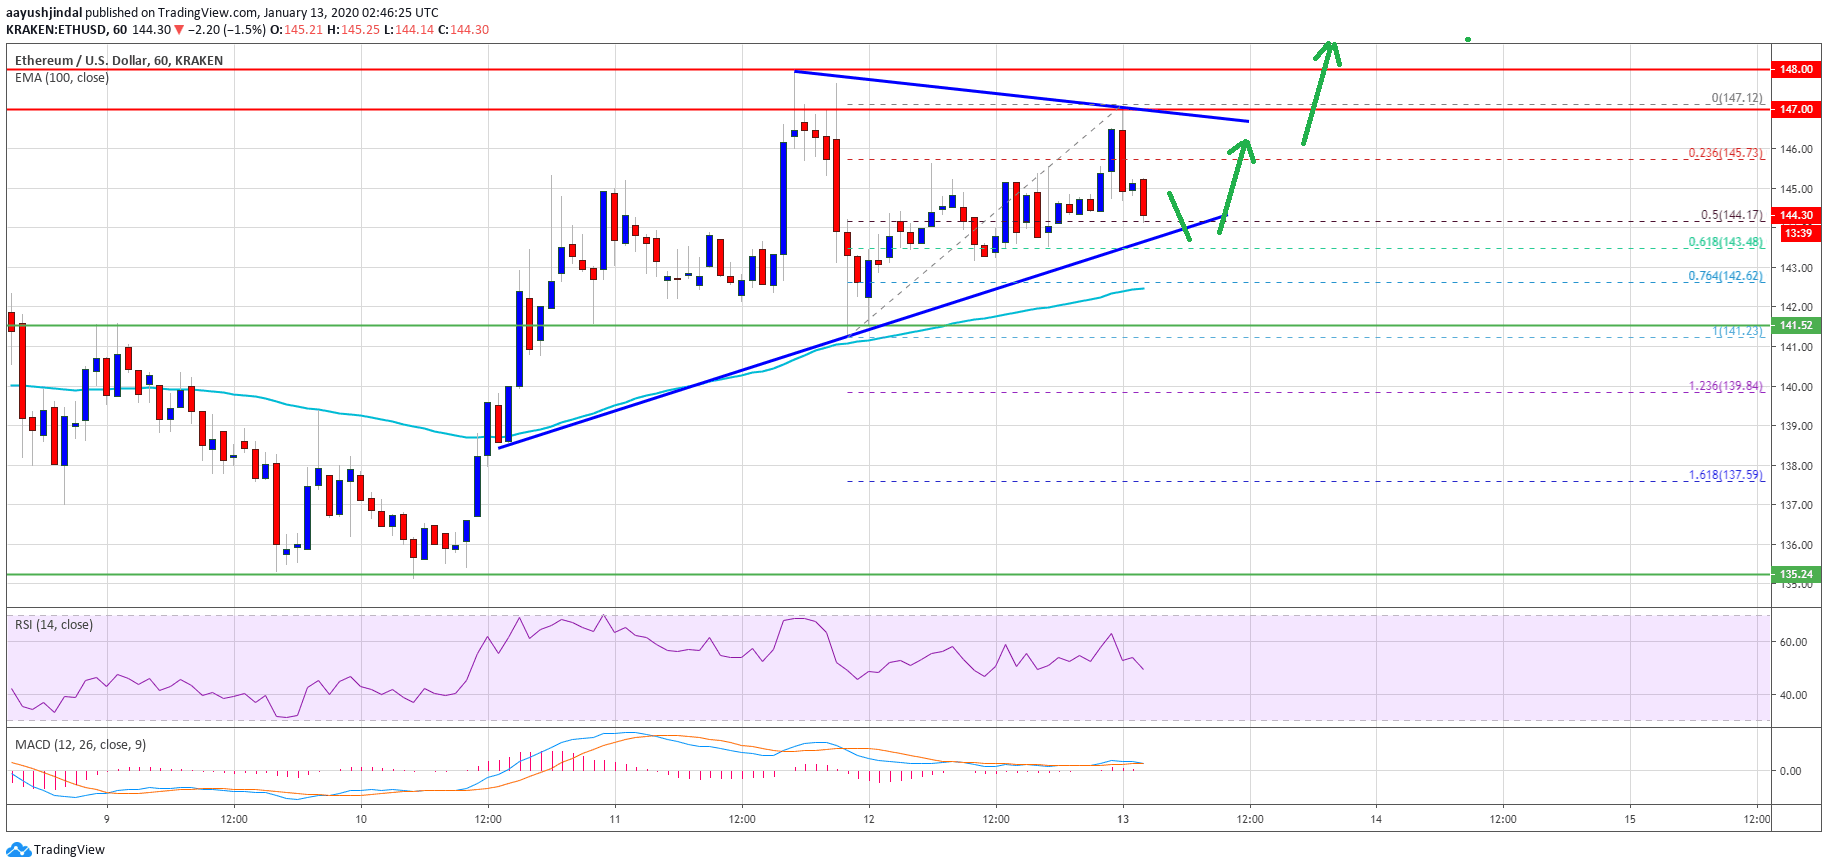
Ethereum is showing positive signs above the $142 and $140 supports versus the US Dollar. ETH is likely to smash $148 and $150 to start a new rally, especially if bitcoin rallies above $8,200.Ether price is holding the key $140 and $142 support levels against the US Dollar.The price is struggling to clear $148, but there are high chances of an upside break.There is a key breakout pattern forming with resistance near $147 on the hourly chart of ETH/USD (data feed via Kraken).The pair could correct a few points, but the $142 support area is likely to act as a strong buy zone.Ethereum Price Could Rally SoonIn the past few sessions, Ethereum mostly consolidated in a range above the $140 support against the US Dollar. Moreover, ETH price settled above the $141-142 zone and the 100 hourly simple moving average.However, the $148 resistance zone is still acting as a key hurdle for the bulls. The last swing high was near $147 and the price is currently correcting lower. It traded below the $145 support level.Besides, there was a break below the 23.6% Fib retracement level of the recent wave from the $141 swing low to $147 swing high. On the downside, there are many supports, starting with $144.It seems like the 50% Fib retracement level of the recent wave from the $141 swing low to $147 swing high is likely to act as a support. Ethereum PriceOn the upside, there are key hurdles forming near $147 and $148. More importantly, there is a key breakout pattern forming with resistance near $147 on the hourly chart of ETH/USD.Therefore, a clear break above the $148 resistance is likely to set the pace for more upsides above the $150 and $152 resistance levels in the near term. The next key resistance is seen near $158.What If ETH Fails to Clear $148?On the downside, the first major support is near the $142 level, below which Ethereum price might retest the $140 support. Any further losses below the $140 support and the 100 hourly SMA may perhaps start a substantial decrease towards the $132 level.Looking at the chart, Ethereum price is clearly struggling to surpass the $148 resistance. Having said that, the market sentiment is in favor of the bulls, which is likely to trigger a new rally above $148.Technical IndicatorsHourly MACD – The MACD for ETH/USD is slowly moving into the bearish zone.Hourly RSI – The RSI for ETH/USD is currently declining and now below the 50 level.Major Support Level – $142Major Resistance Level – $148
