Over the past few days, Ethereum has been one of the top-performing crypto-assets in the industry. The token recently breached the $200 mark and since 5 February, the crypto-asset has surged by over 20 percent. Bitcoin recorded a hike of 7.75 percent over the same time period.
At press time, Ethereum was priced at $225.30 with a market cap of close to $25 billion. Over the past 24 hours, ETH had registered a 2.40 percent hike.
1-day chart

Source: ETH/USD on Trading View
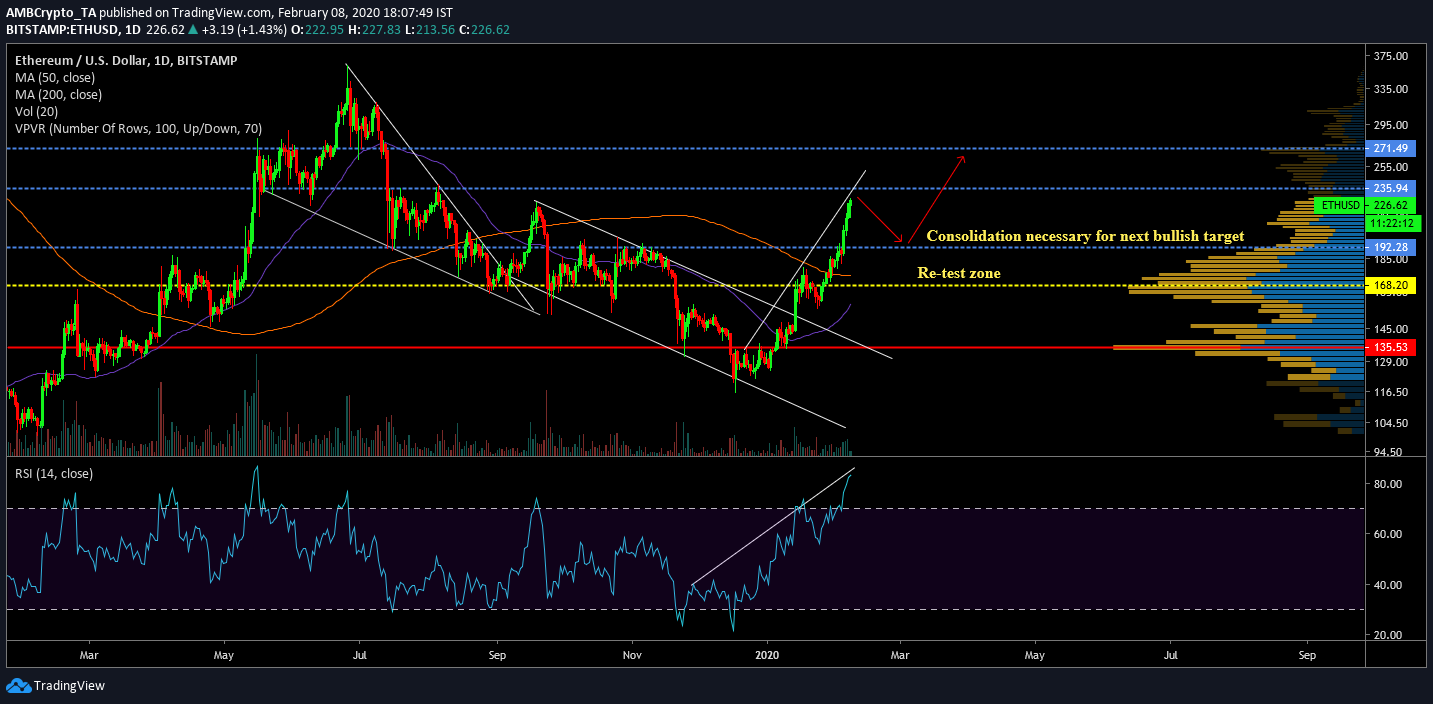
Ethereum’s one-day chart identified two previous patterns that manifested into a bullish breakout on both occasions. The first falling wedge was observed from July to September and registered a minor breakout during the end of the month. The last descending channel was positively breached on 14 January, when the collective market witnessed a significant surge.
Since hitting $116 mid-December, ETH has managed to breach past key resistances over the past 45 days, improving the bearish sentiment in the market. At the moment, the latest spike on 5 February allowed Ethereum to breach major resistance at $193 for the first time since last October. The token also moved above its psychological resistance at $200 and at press time, it was valued at $225.30
Such a scenario also increases the possibility of a period of correction.
A positive consolidation period between the resistance of $235 and support of $192 should take place over the next few days before a re-testing of the major resistance at $271. Exhaustion of bullish momentum may trigger a slump before $192, but a drop below $168 is least likely in the coming weeks.
However, according to the Relative Strength Index, the indicator is forming a bullish incline with the price, as observed in the charts. An absence of divergence suggested that the bullish sentiment is fairly high at the moment, high enough to entertain a flash crash.
Another indicator highlighting bullishness is the 200-moving average, which became active support on 31 January for the first time since last September.

Source: Twitter

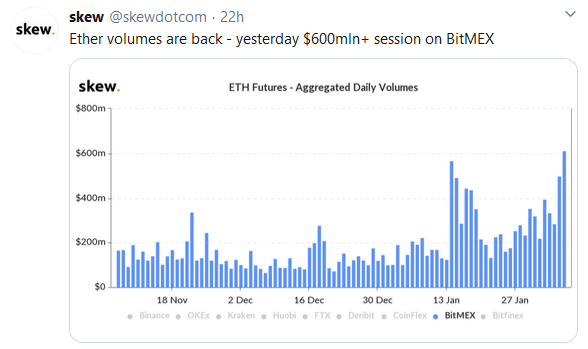
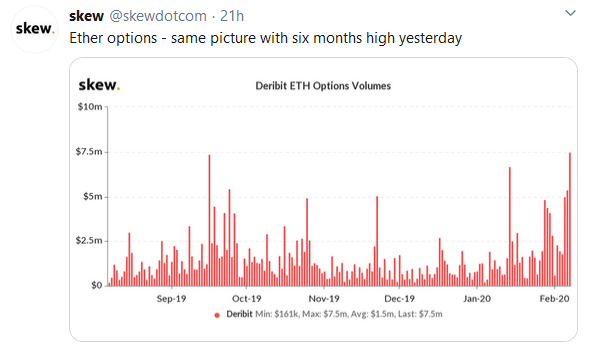
A favorable trend for the price can also be witnessed with the activity witnessed in the derivatives market. BitMEX registered over 600 million in ETH Futures volumes and Deritbit’s ETH Options witnessed a six-month high at the same time as well.
Conclusion
Ethereum’s price is due for a correction, a development that may facilitate sideways movement over the next week. A possible re-test of the resistance at $273 may surface towards the end of March.

