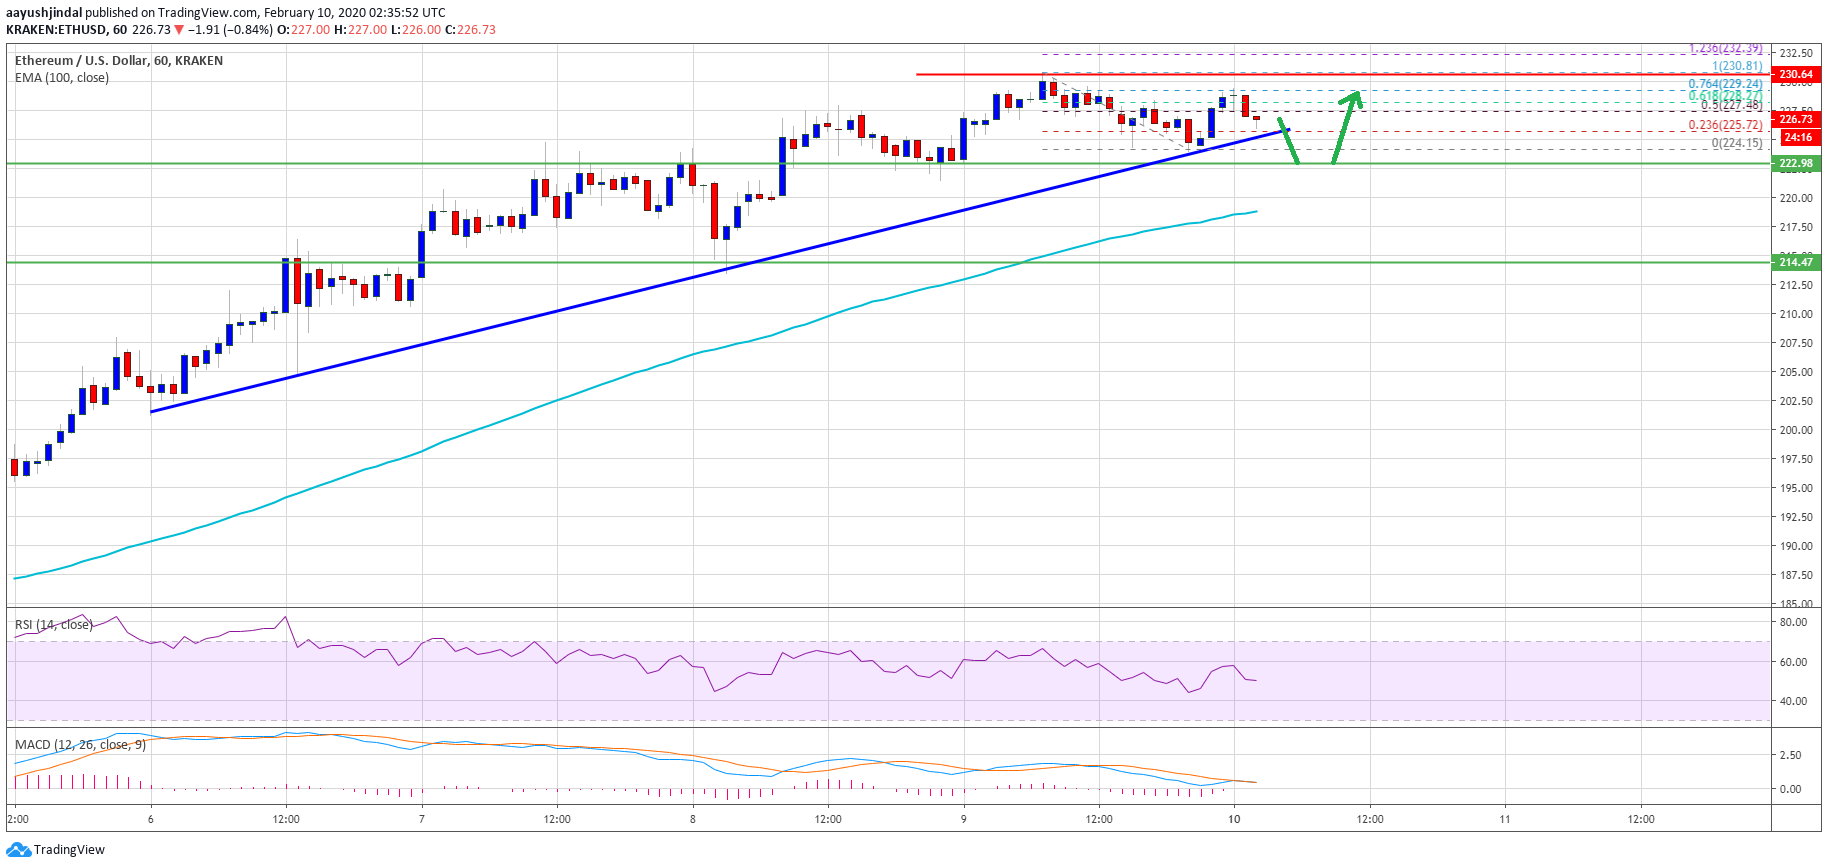
Ethereum price extended its rise above the $220 resistance area against the US Dollar. ETH is currently facing hurdles near $230 and it could correct in the short term.Ethereum is facing a key resistance near the $230 area against the US Dollar.The price might correct a few points towards $223 or $220 before climbing again.There is a major bullish trend line forming with support near $225 on the hourly chart of ETH/USD (data feed via Kraken).Bitcoin price is now trading well above the key $10,000 resistance area.Ethereum Price Could Correct In Short TermIn the past few days, Ethereum followed a strong uptrend and broke the $210 and $220 resistance levels against the US Dollar. ETH price even settled above the $220 level and 100 hourly simple moving average.Recently, the price tagged the $230 area, where the bears took a stand. The bulls made two attempts to lead the price above the $230 level, but they failed.As a result, the price started consolidating gains and it is currently correcting lower from $230. The price dipped below the $225 level before it found support near $224. It bounced back above the 50% Fib retracement level of the recent decline from the $230 high to $224 low.However, Ethereum is again facing hurdles near the $230 level. Besides, the 76.4% Fib retracement level of the recent decline from the $230 high to $224 low is also acting as a resistance.On the downside, there is a major bullish trend line forming with support near $225 on the hourly chart of ETH/USD. Therefore, a break below the trend line might push the price towards the $223 support area. Ethereum PriceAny further losses may perhaps lead the price towards the $220 support area. The next major support is near the $215 level. An intermediate support is $218 and the 100 hourly simple moving average.Fresh Increase?Once the current consolidation phase or a minor correction is complete, Ethereum price is likely to bounce back above $228 and $230.A clear break above the $230 resistance level could open the doors for more gains. The main targets this week are $240 and $250. If the price hits $250, there are chances of another downside correction.Technical IndicatorsHourly MACD – The MACD for ETH/USD is slowly moving into the bearish zone.Hourly RSI – The RSI for ETH/USD is currently declining and it is now just below the 50 level.Major Support Level – $222Major Resistance Level – $230
