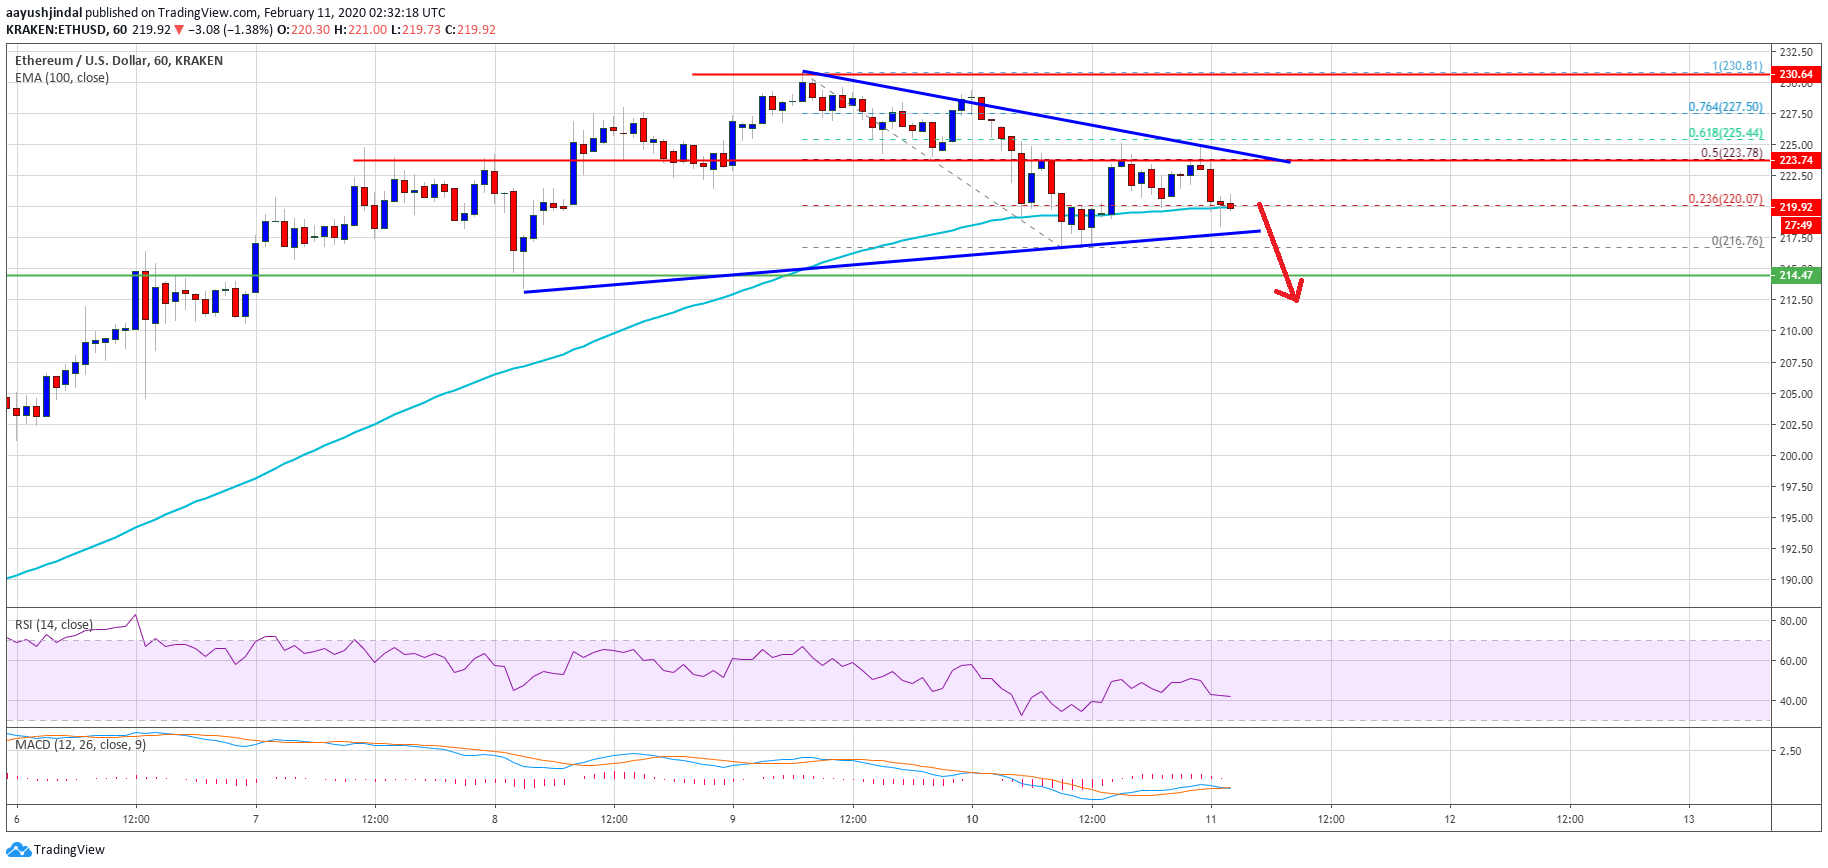
Ethereum price started a downside correction from the $230 swing high against the US Dollar. ETH is currently declining and it remains at a risk of more losses below $215 and $2152.Ethereum declined below the $225 and $220 support levels against the US Dollar.The previous support at $225 is now acting as a major resistance for the bulls.There is a key contracting triangle forming with support near $218 on the hourly chart of ETH/USD (data feed via Kraken).Bitcoin price is also sliding and it recently traded below the $9,800 support area.Ethereum Price Could Correct FurtherAfter trading to a new 2020 high at $230, Ethereum started a downside correction (as mentioned in yesterday’s post) against the US Dollar. ETH price declined below the $225 and $222 support levels.Moreover, there was a break below the $220 support and 100 hourly simple moving average. A swing low is formed near $217 and the price is currently consolidating in a range.There was a break above the 23.6% Fib retracement level of the recent drop from the $230 high to $217 low. However, the price seems to be facing hurdles near the $224 and $225 levels.On the downside, there is a decent support forming near the $218 area. Besides, there is a key contracting triangle forming with support near $218 on the hourly chart of ETH/USD. If Ethereum fails to stay above the $218 support area, there is a risk of a larger downside correction. Ethereum PriceThe next key support is seen near the $212 level. Any further losses may perhaps lead the price towards the $205 and $202 support levels. The next major support is near the $200 handle.Chances of Upside BreakOn the upside, the previous support at $225 is now acting as a major resistance for Ethereum bulls. If they succeed in gaining strength above the $225 resistance area and the triangle barrier, there could be a fresh increase.A clear break above the $225 resistance level could open the doors for a break above the $230 resistance area. In the mentioned case, the price is likely to hit the $240 and $250 levels in the near term.Overall, the price remains at a risk of more downsides below $218 and $215, but it is likely to find a strong support above $200 and $202.Technical IndicatorsHourly MACD – The MACD for ETH/USD is slowly gaining pace in the bearish zone.Hourly RSI – The RSI for ETH/USD is currently declining and it is now below the 50 level.Major Support Level – $218Major Resistance Level – $225
