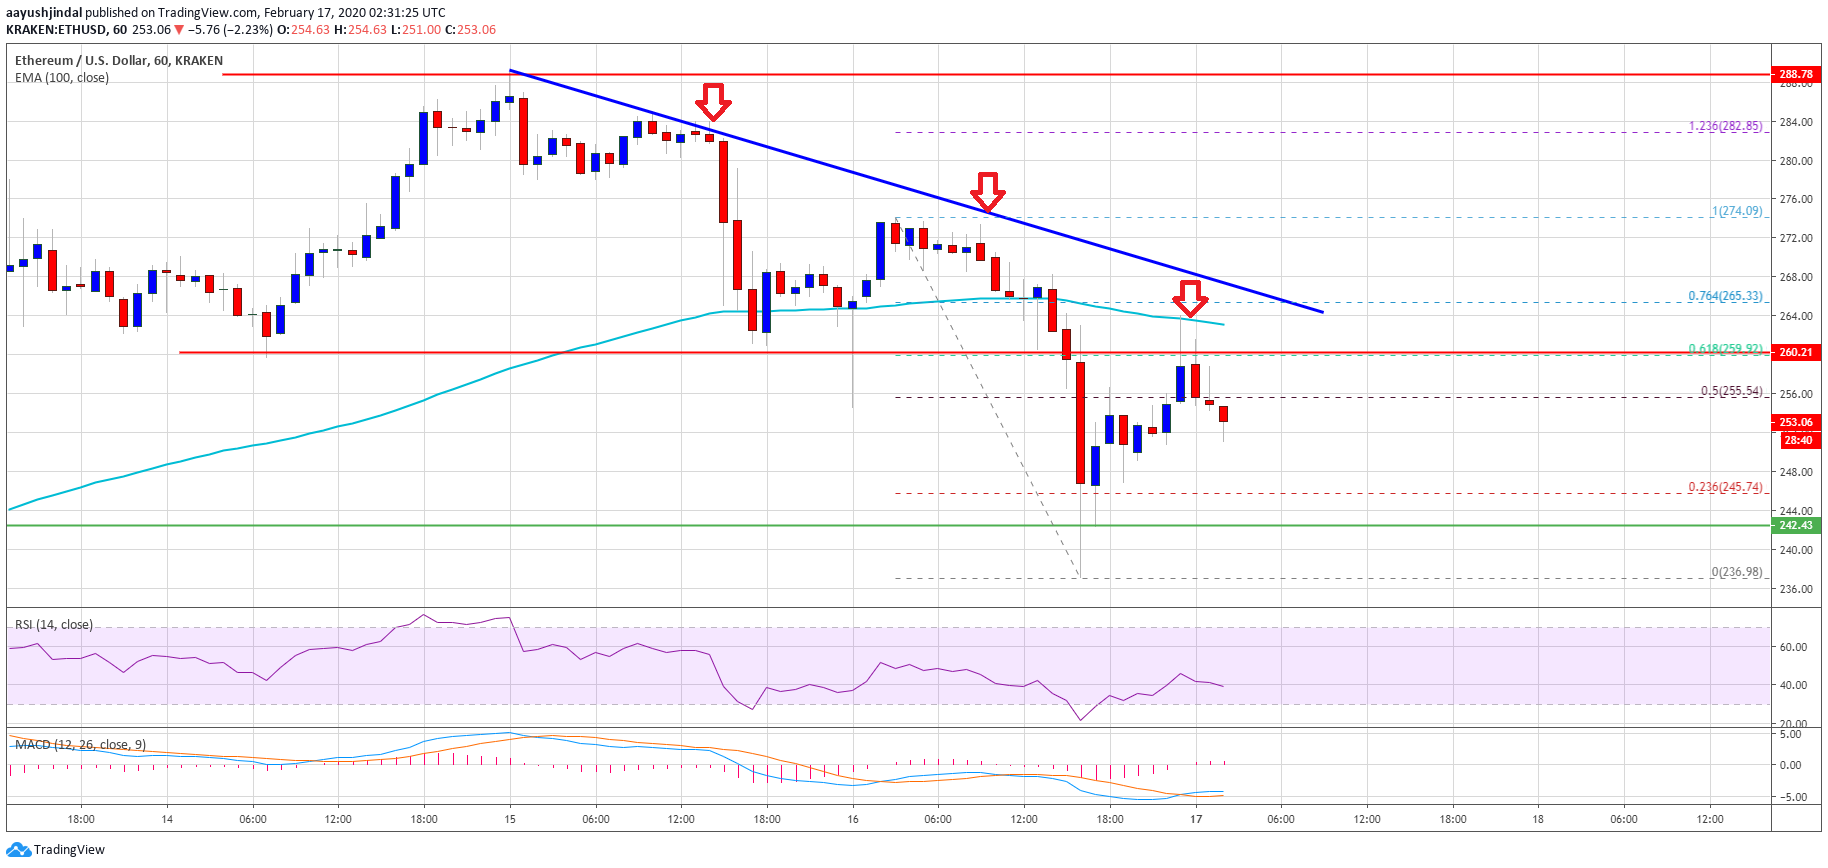
Ethereum started a sharp decline below the $265 and $260 support levels against the US Dollar. ETH even tumbled below $250 and it is currently correcting losses.Ethereum is down more than 8% and it even spiked below the $250 support against the US Dollar.The price traded as low as $236 and it is currently recovering losses.There is a major bearish trend line forming with resistance near $264 on the hourly chart of ETH/USD (data feed via Kraken).Bitcoin price is also under pressure and it is trading below the $10,000 level.Ethereum Price Facing HurdlesAfter starting a downside correction, Ethereum struggled to stay above the key $265 support against the US Dollar. As a result, ETH price declined sharply below the $250 support and the 100 hourly simple moving average.The bears gained traction and the price declined below the $242 support. A swing low is formed near $236 and the price is currently correcting losses. It broke the $242 and $245 levels.Besides, there was a break above the 23.6% Fib retracement level of the recent dive from the $274 high to $236 low. Ethereum even recovered above the $255 level, but the price failed to continue above the $260 area.It seems like the previous key support near $260 is acting as a strong hurdle for the bulls. More importantly, there is a major bearish trend line forming with resistance near $264 on the hourly chart of ETH/USD. Ethereum PriceThe 50% Fib retracement level of the recent dive from the $274 high to $236 low is also near the $260 area and acting as a hurdle for the bulls. Therefore, a clear break above the $260 level, 100 hourly simple moving average, and the trend line is needed for a fresh increase in the near term.More Losses?If the price fails to recover above $260 and the 100 hourly simple moving average, there are chances of more losses in the near term.An initial support is near the $242 level. If there is a downside break below the $242 support, there is a risk of more losses below the $240 support area in the coming sessions. The next major support could be $235 and $232 levels.Technical IndicatorsHourly MACD – The MACD for ETH/USD is slowly moving back into the bullish zone.Hourly RSI – The RSI for ETH/USD is currently declining and it is well below the 50 level.Major Support Level – $242Major Resistance Level – $265
