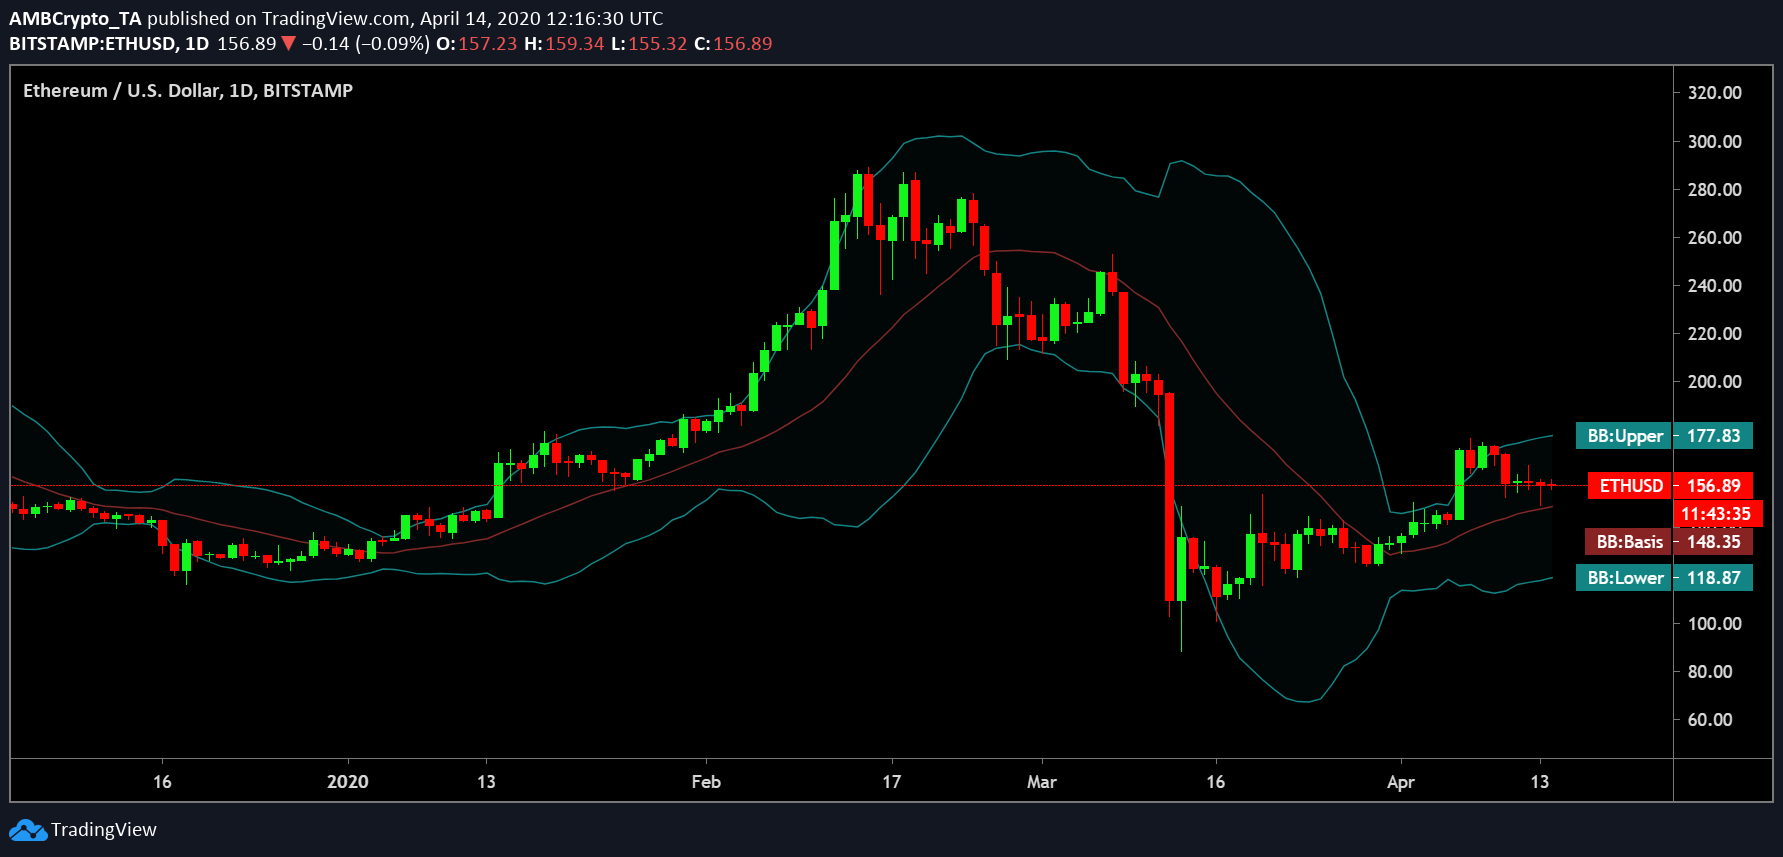
The world’s largest altcoin, Ethereum, was trading at a price of $156, at the time of writing, following a period of volatility, something confirmed by the diverging Bollinger Bands on the charts. It should be noted, however, that the coin did manage to avoid volatility at the beginning of April, following the high sell-off that gathered pace last month. At the time of writing, ETH was being traded within a tight range, with the direction of its price movement still a bit uncertain.

Source: ETH/USD on TradingView
Ethereum’s network value to transactions [NVT] was found to be in neutral territory. This is indicative of the coin moving in an uncertain path. After a substantial recovery following the devastation of Black Thursday, the NVT sneaked into the bearish territory, registering an upward trend for the coin.
This trend has, however, changed, as depicted in the chart below, which showed that ETH’s NVT [yellow portion] was in neutral territory based on the last 12 days of data collection.

Source: Santiment Insights | ETH Price/NVT ratio
The latest insights from Santiment argued that the neutral bar is “misleading,” primarily because the NVT on 12 April was observed to be “extremely poor,” something that is a positive signal. On the same day, ETH was up by over 5%. The report further noted,
“Market sentiment seems to be a very wary and cautious bag right now.”
Whenever this happens, trading tends to “freeze up” and “wait for a bit move in one direction or another.” Even though the chart for Ethereum appeared to be in a state of a “wait and see” at the time of writing, based on the last couple of days, however, a pullback to the $140s level wouldn’t be surprising, “before finding some alleviation in its high NVT.” A similar phase was recorded for Bitcoin as well.

Source: Santiment Insights
At the time of writing, traders were treading lightly as transaction volume indicated that there was significant reluctance all across the market. Additionally, the presence of “obvious fear” was preventing Bitcoin from circulating between addresses the way it happened in late-January and all of February [during the 2020 bull run].
The previous highs for Bitcoin’s NVT were recorded in February 2011, October 2014, and October 2018, all of which were followed by bearish price movements. Hence, it would be interesting to see whether its movement remains muted along the current level or if it goes up.
While overall network fundamentals were positive, the same cannot be said about the number of transactions on Bitcoin’s blockchain, a figure that has been stuck below the 300,000-level since 13 March. At the time of writing, the cryptocurrency was continuing to attempt breaching the $7000-mark.

Source: Coinstats
