Over the course of April, Ethereum’s market has improved drastically on the charts. Over the past week itself, ETH registered positive returns of 9.86 percent and over the past 24-hours, a 3.81 percent spike was registered. As the 2nd largest crypto-asset aims to breach its resistance of $200 over the coming week, a couple of possibilities need to be analyzed.
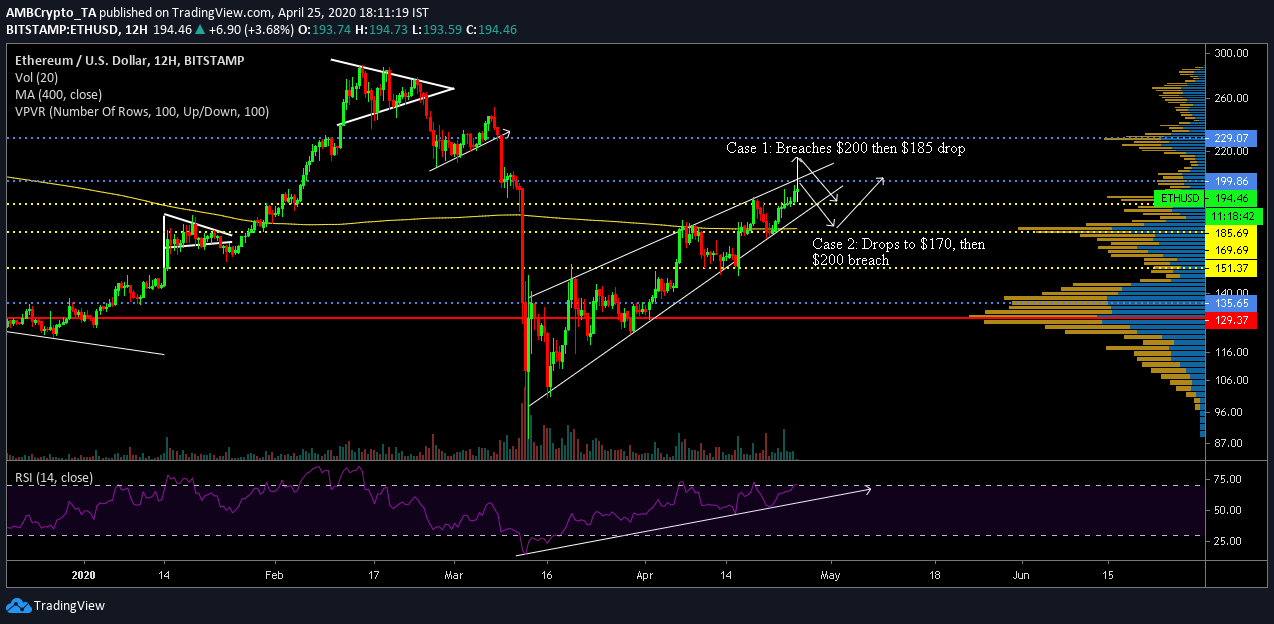
Ethereum 12-hour chart
Ethereum has been on a steady incline since 12 March on the charts and its price movement has given rise to the formation of a rising wedge. The pattern hasn’t been breached yet over the past 30+ days. In line with the trend lines, ETH registered lower highs at $101, $124, $148 and $170, and clear higher highs were formed at $153, $172 and $189.
The Relative Strength Index or RSI also pointed to increasing buying pressure over the month, exhibiting a return of investors into the market.
With the 200-Moving Average turning support on 18 April after the token breached its resistance $170, the press time market may play out in a few ways,
Case 1: Breach of $200 before $185 re-test
Considering the fact that bullish momentum is high on the charts, there is a good chance Ethereum may cross $200 over the next week. However, the rising wedge pattern suggested that a bearish breakout would take place eventually, something that might see the token register a re-test at $185 after the rise. The VPVR indicated that $185 was holding as strong support, hence, a bounce from this range is foreseeable.
Case 2: Drop down to $170 before breaching $200
After registering 5 back-to-back green candles over the week, it is inevitable that a bearish pullback would take place. Although Ethereum is valued at $194, resistance strength at $200 may allow Ethereum to drop down to $170, before breaching $200.
Support at $170 has been a strong base since last year until the collapse took place on 13 March. Hence, ETH should be able to bounce back from $170 and eventually breach resistance at $200 by the first week of May.
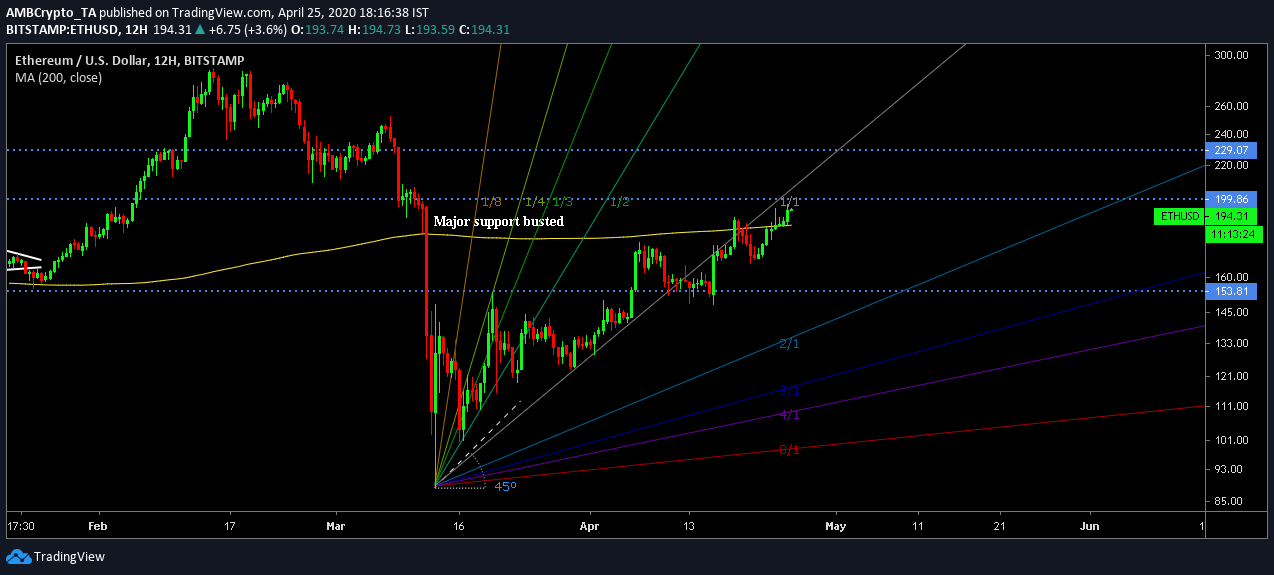
Gan-Fann indicate a bearish reversal

Source: ETH/USD on TradingView
Analyzing the input of Gan-Fann, it could be inferred that corrections may come next week. ETH’s price was hovering under the 1:1 line, which is a bearish signal over the long-term.
However, the price continued to mediate at close proximity to the 1:1 ratio, meaning the bullish momentum still had a significant grip on the market.
Conclusion
Ethereum should see a quick re-test at $170, before Ethereum recalibrates its compass to breach the $200 level again.

