Ethereum 2.0 has so far failed to propel the largest altcoin above $200-mark. However, it achieved a positive momentum and was currently trading in the $190-area close to the monthly high. Ethereum might be ready for a much-needed bullish breakthrough.
Ethereum Daily Chart:
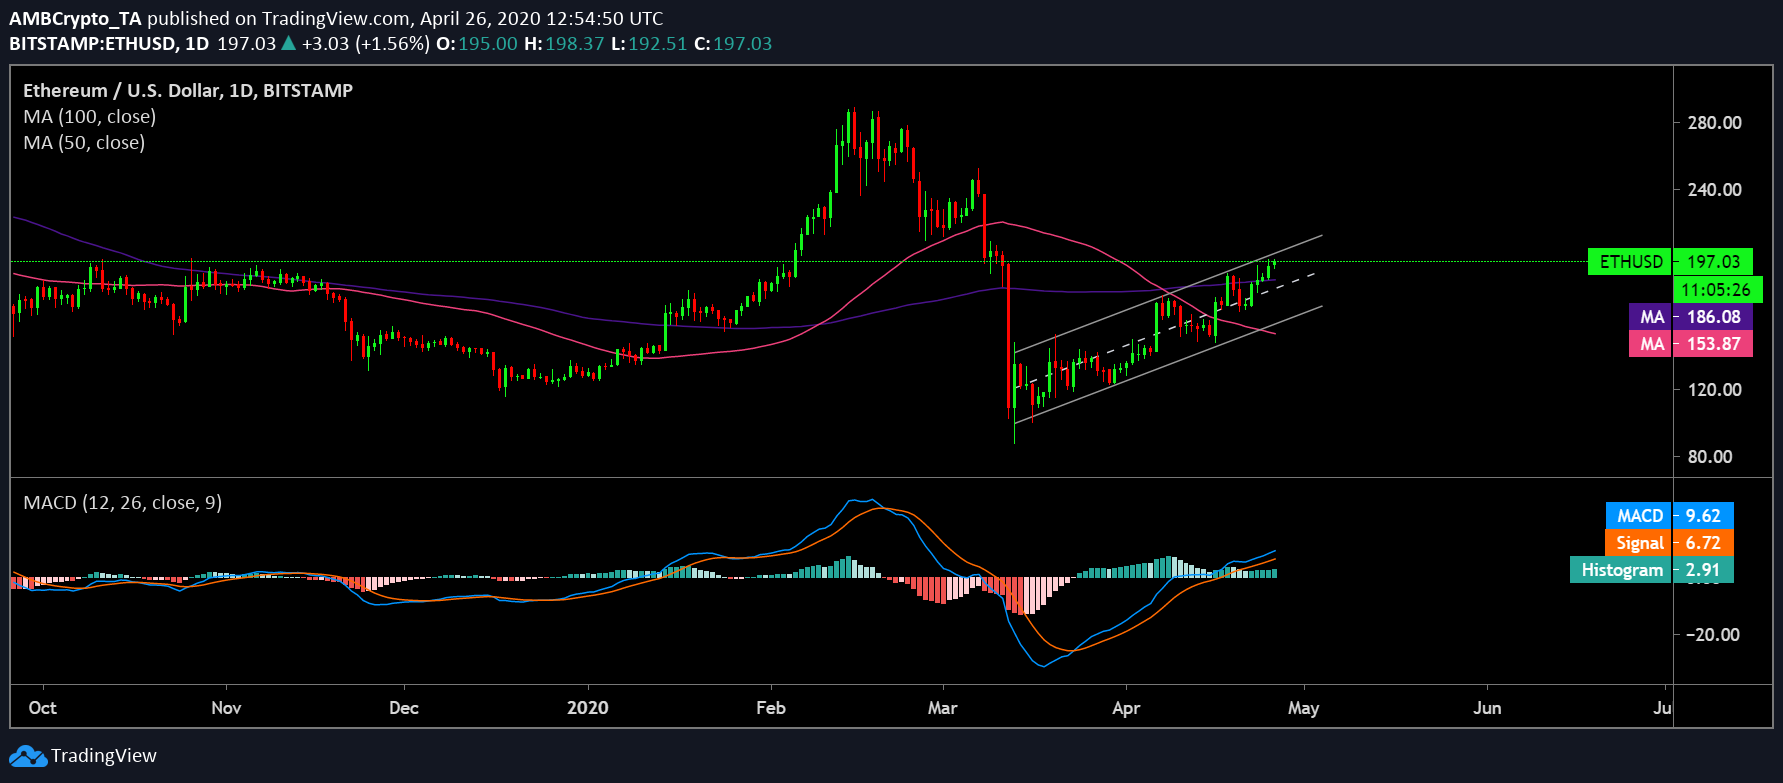
Ethereum’s price has been on an incline after the fateful day of 12th March. This price action was oscillating within the rising trendlines and formed an ascending channel. The completion of this pattern would potentially lead to a bearish breakout.
However, the moving averages had a different story to tell. While the gauge expanded after the bearish crossover, a crucial indicator of a trend reversal was the fact that both the 50 and 100 DMA slid below the ETH price candles on 16th April, depicting the rising bullishness on the daily chart.

Source: ETH/USD on TradingView
Scenario 1:
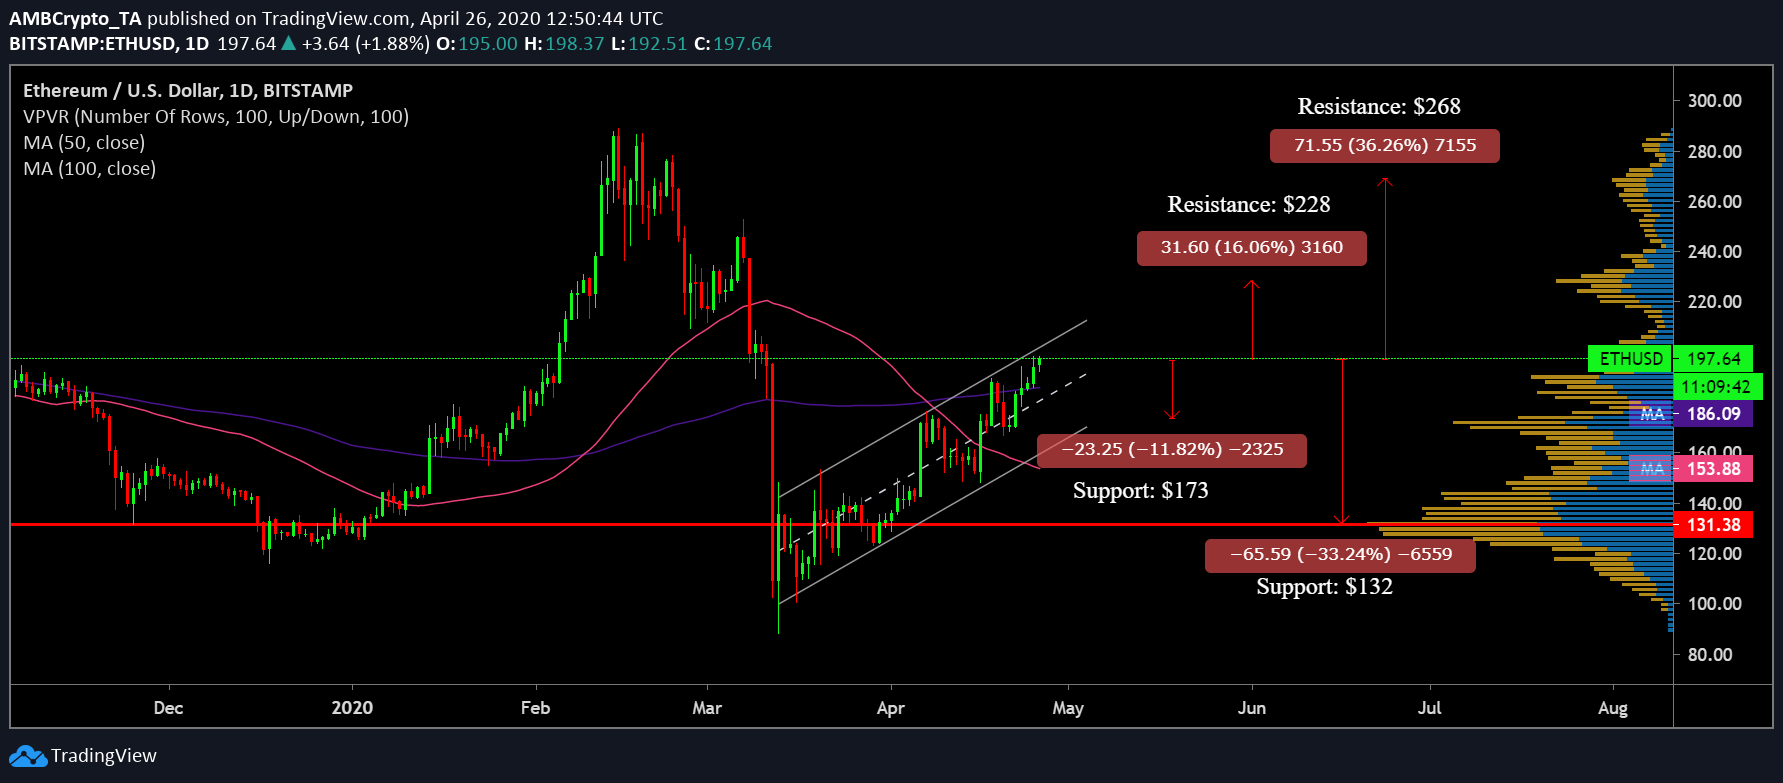
A bearish breakout was supported by formation of an ascending channel pattern that has taken shape for over a period of more than 45 days. And if this materializes, the coin could slide all the way down to $173, a point that has seen high trading activity, as depicted by VPVR indicator. If this trend persists, the coin could revisit $132-level, another point which saw a substantial trading volume.
Scenario 2:
Not all hope is lost for the second-largest cryptocurrency as a bullish breakout could be right around the corner. This argument was supported by the moving averages hovering below ETH price candles. Further, MACD also aligned with the bulls, signaling a breakout to the positive side. On breaching the $200-level, the coin could climb all the way $228. If the bullish trend continues, the coin could be resisted at $268-level.
Correlation:
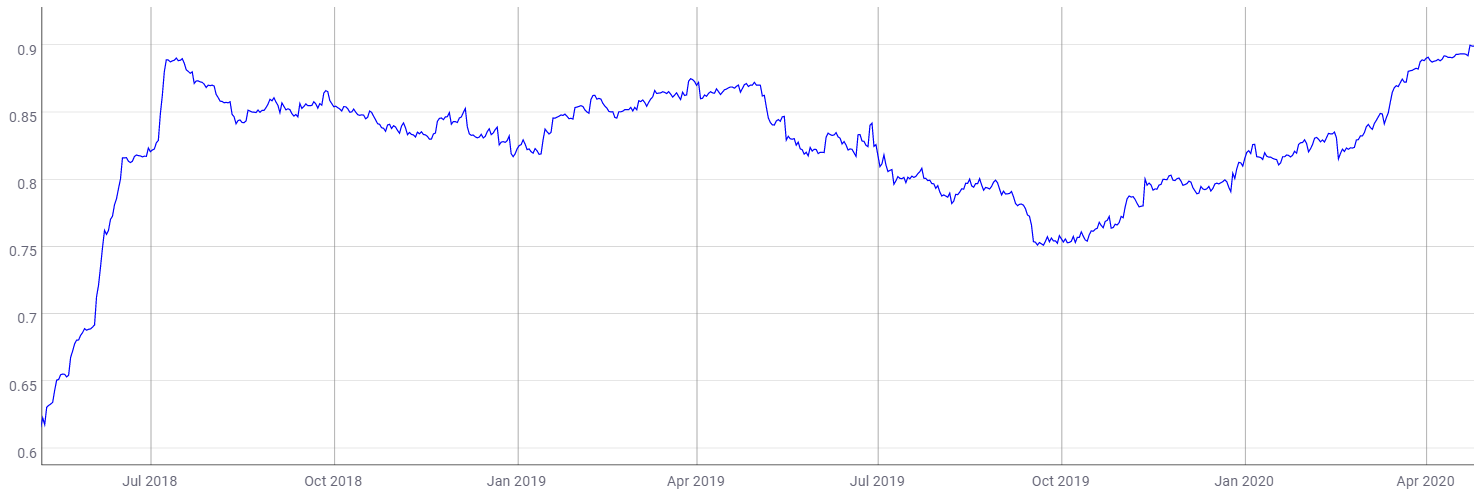
Ethereum has enjoyed the latest bullish price action by Bitcoin due to its high correlation. On 23rd April, BTC-ETH correlation reached an all-time high of 0.90. This indicated that if Bitcoin manages to hold on to the bullish trend, this would significantly prompt Ethereum to edge with the bulls as well.

Source: CoinMetrics
Conclusion:
A bearish breakout appeared to be imminent. In this case, the coin’s target stood at resistance $228, a level that has seen high trading activity. Another target point stood at $268-level. In case of an unlikely scenario of a bearish breakout, the coin’s price could retrace to $173 and $132.

