Like most altcoins, Ethereum registered a widely inconsistent 2020. After an initial rally towards the start of the year, a pullback was witnessed during the third week of February, following which, a Black Swan event almost toppled the world’s largest altcoin.
Bitcoin noted a similar dilemma as well, but the market has been resilient since March and quick recoveries have been attained. Bitcoin’s fundamental statistics were irregular as well but since March, it has been all uphill for the crypto-asset.
However, a completely different landscape for Ethereum’s network was identified.
Data from etherscan.io suggested that regardless of price actions, Ethereum’s network has incurred a steady rise in terms of network usage since the beginning of 2020.

Source: etherscan.io
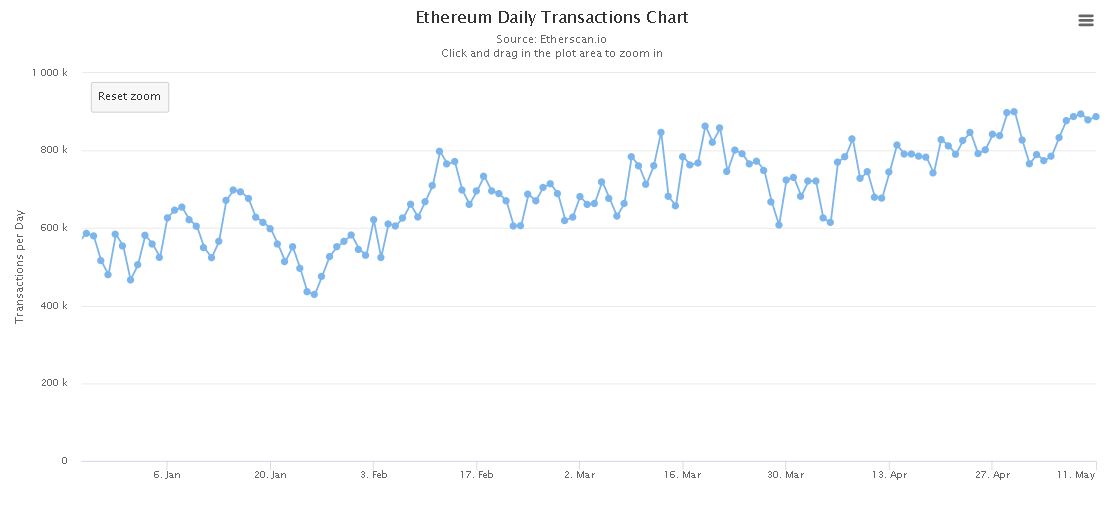
The daily transaction count surged from 466,526 on 1 January, all the way up to 887,554 on 11 May. This was the highest recorded level since July 2019, when the average was around 837k. However, the average was beaten on 30 April itself.
The number of unique ETH addresses also rose from 83.9 million on 31 December 2019, to 97 million on 11 May 2020.

Source: etherscan.io
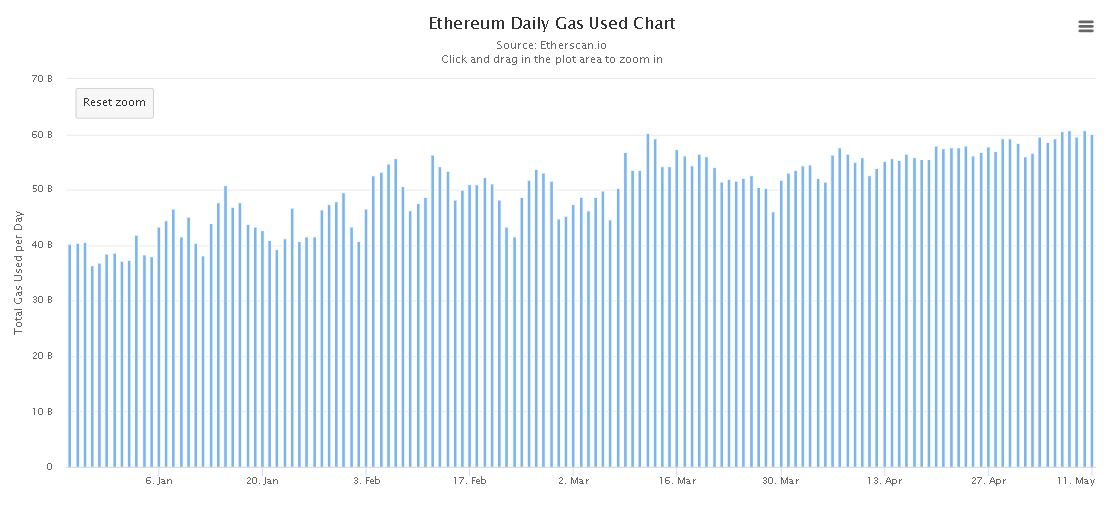
The increasing transaction count was completely matched by the ETH daily gas used which improved from 37 million to 60 million levels, marking all-time-high gas usage levels that were last seen back in September 2019.
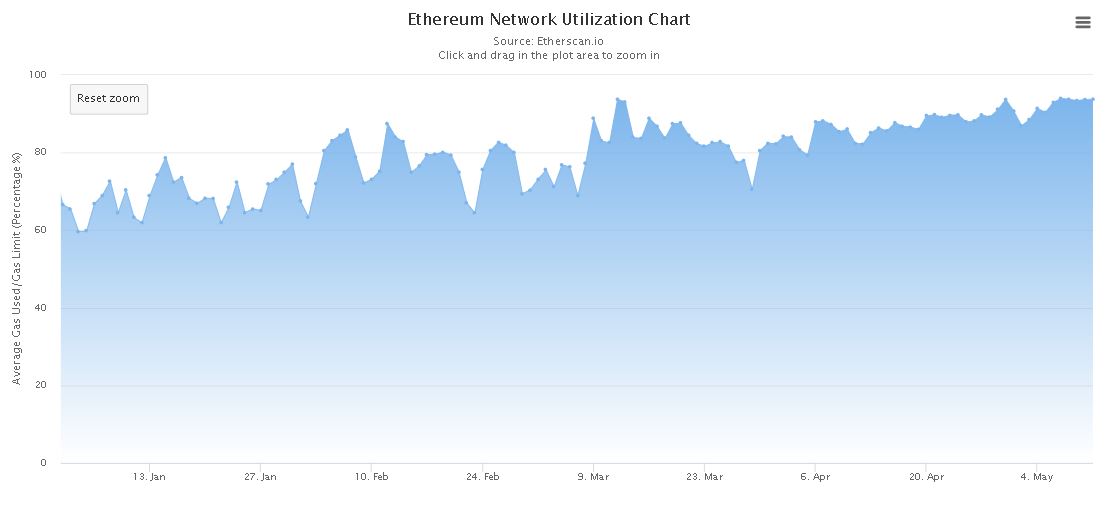
In terms of network utilization, 93.77 percent of the ETH network is active at the moment, a figure that is significantly higher than the 66.61 percent utilization index back on 1 January.

Source: etherscan.io
Stablecoin impact and Ethereum 2.0 anticipation
After the major market collapse on 12 March, stablecoins issued on Ethereum reached astronomical levels. The market cap of stablecoins doubled between March and April, and Ethereum reflected most of its growth in the above charts.
On 21 April, the market cap that was operational on Ethereum’s network was above $8.8 billion. However, while the issuance came to a halt in early-April, the increasing usage of the network continued.
This is where the high anticipation surrounding Ethereum 2.0 receives validation.
When the Ethereum 2.0 Beacon Chain testnet Explorer was launched last month, the number of ETH addresses with 32 ETH in balance rose dramatically. 32 ETH is a must to be a validator in the new system, and the number of validators addresses jumped to record high last week.
Hence, the above data in terms of network usage and validators could be a sign of things to come for Ethereum, as the ecosystem braces itself for the launch of Phase Zero of ETH 2.0 in the coming months.
