The latest market dip drove the largest altcoin, Ethereum to a value of $204.19. The coin narrowly avoided a collapse below the psychological level of $200 and it appears that it could be headed for a fresh upswing.
Ethereum 4-Hour Chart:
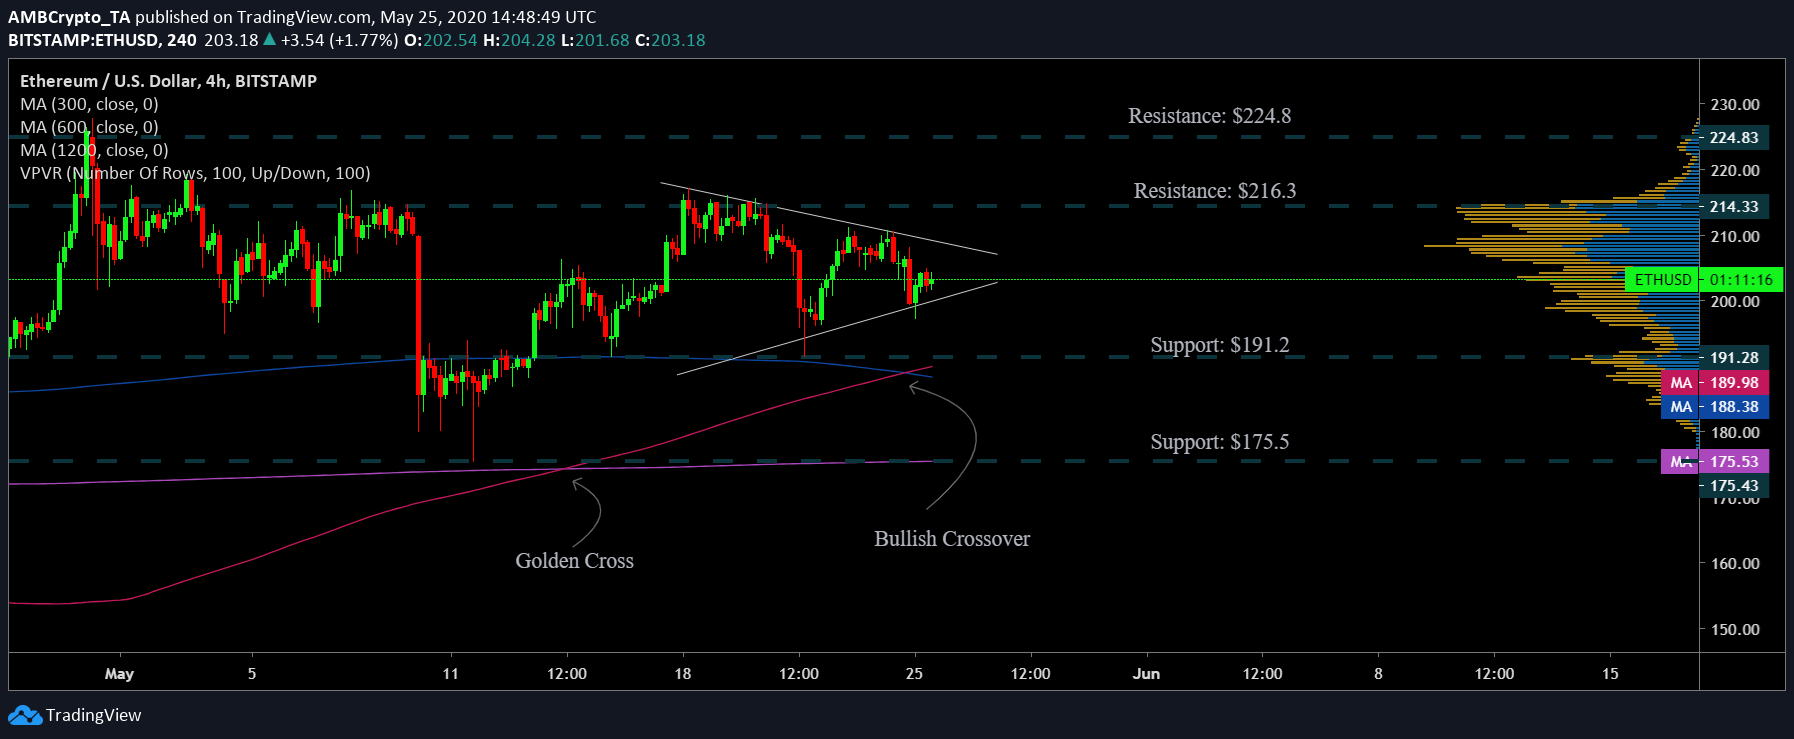
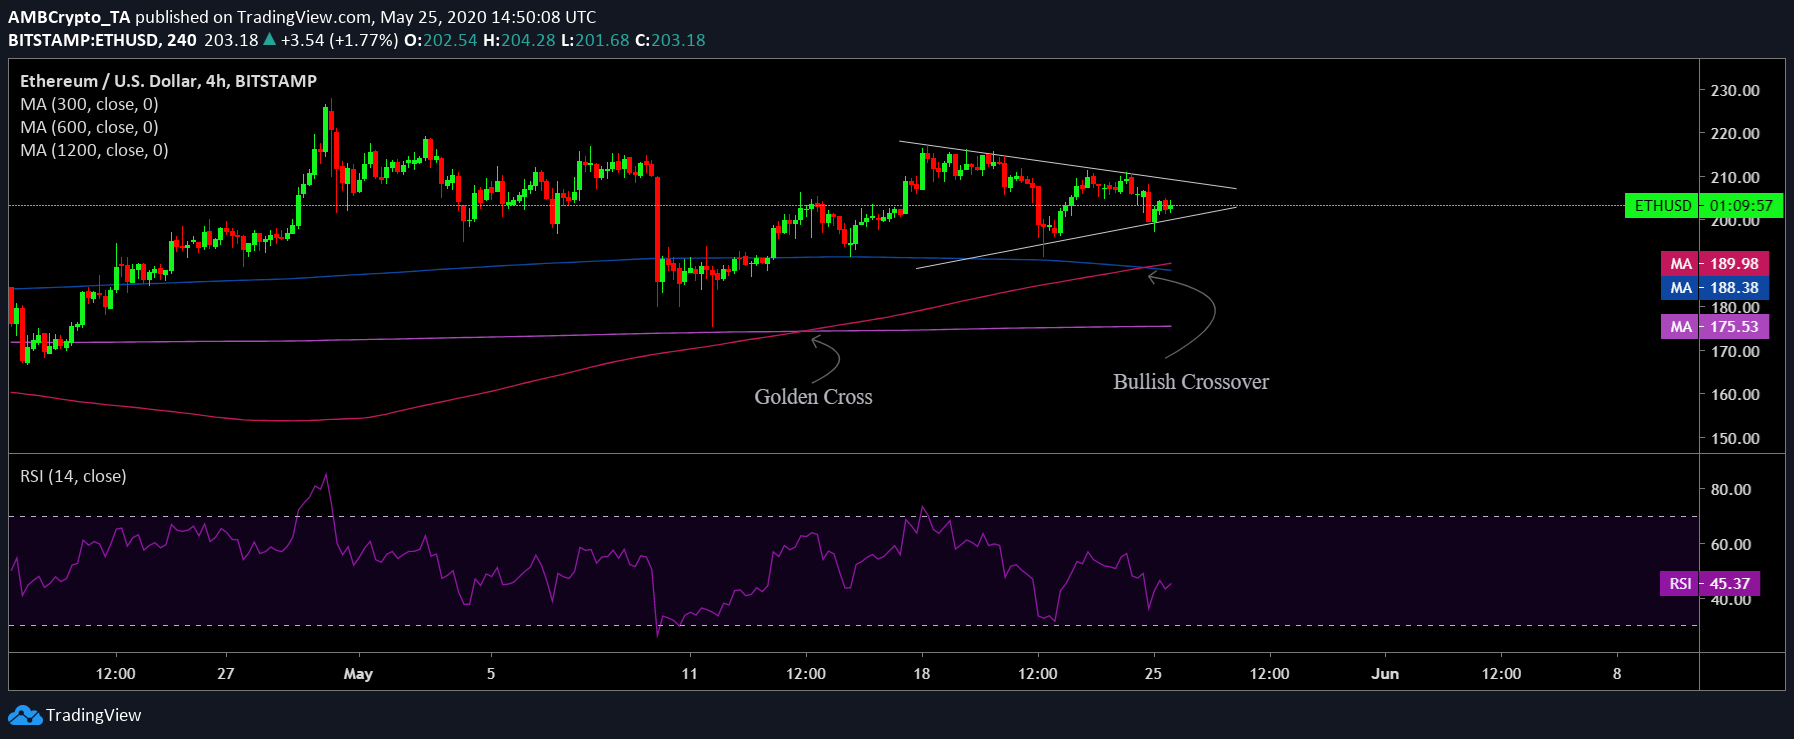
Ethereum’s price candles were found to be oscillating between a symmetrical triangle pattern, a breakout from which could be on either side. Weighing in the daily moving averages it can be noted that all of them were well below the price candles, thus depicting a potential bullish picture for the coin.
Further validating the growing bullishness in the ETH market was the bullish crossover by the 50 DMA [Pink] and the 100 DMA [Blue] just ten days after a golden cross formed by 200 DMA [Purple]. The 50 DMA moving higher the two DMAs also depicted a positive picture.
The Relative Strength Index [RSI] was observed to be moving upward and was only a few points short of the 50-median neutral line. This depicted a decreasing sell pressure and a fresh buying interest among the traders and investors in the ETH market.
Case 1:
A potential bullish case was supported by the placements of all the daily moving averages as well as the RSI. If the price breakout to the positive side materializes, the coin could climb all the way to its immediate resistance point of $216.3, which according to the VPVR indicator indicated a high trading activity. If the coin continues to march upward, it could also breach another resistance level at $224.8 in the near-term.
Case 2:
A case of a potential trend reversal to a bearish flip seems highly unlikely as the coin’s support points stood firm and untested at $191.2, near the 50 and 100 DMAs while another point was found to be at $175.5.
Correlation:

Source: Skew
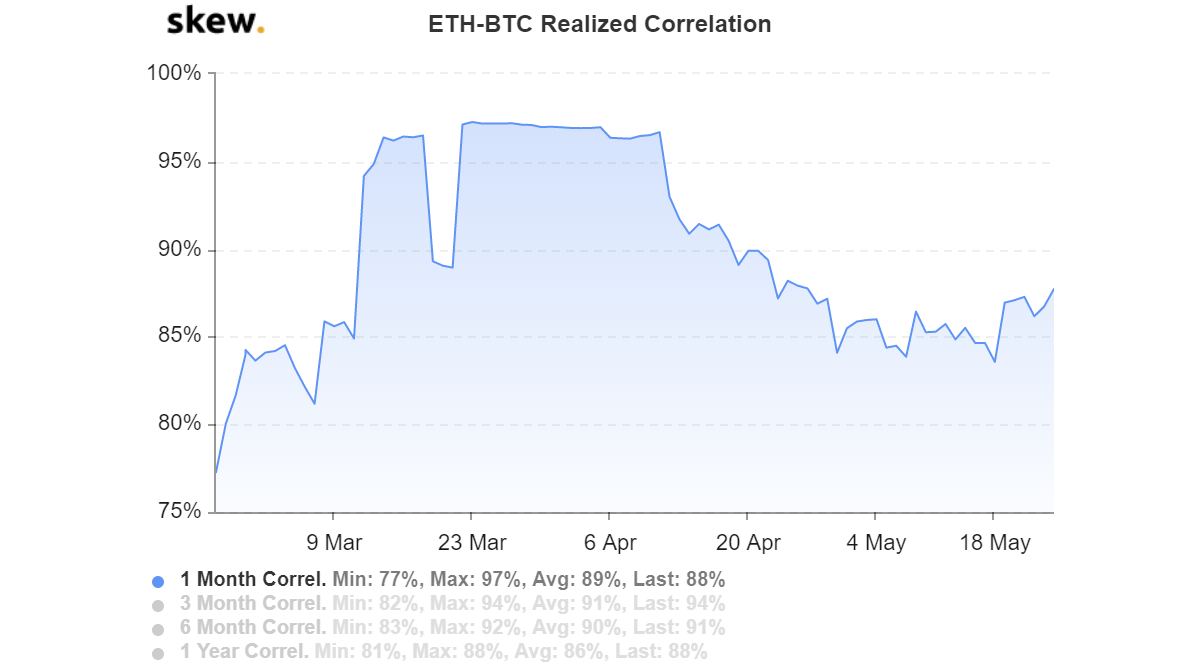
After a minor slump, the ETH-BTC correlation rose to 88% according to the latest Skew charts. This essentially implied that Bitcoin rally would be crucial for Ethereum’s upward price momentum.
Conclusion:
An upside break was anticipated which would potentially propel the coin to surge to target points $216.3 and $224.8 respectively while its support levels stood at $191.2 and $224.8.


