Bitcoin’s price performance marked a strong April for the king coin, with Ethereum following up in May with strong positive returns of its own. However, the month of June has been quite lackluster, especially for Bitcoin. Over the month, Bitcoin has shaved 7.5 percent of its valuation, while Ethereum has registered losses of close to 5.05 percent.
These present price movements of the market’s top two digital assets are currently facilitating a marked difference in their respective on-chain metrics.
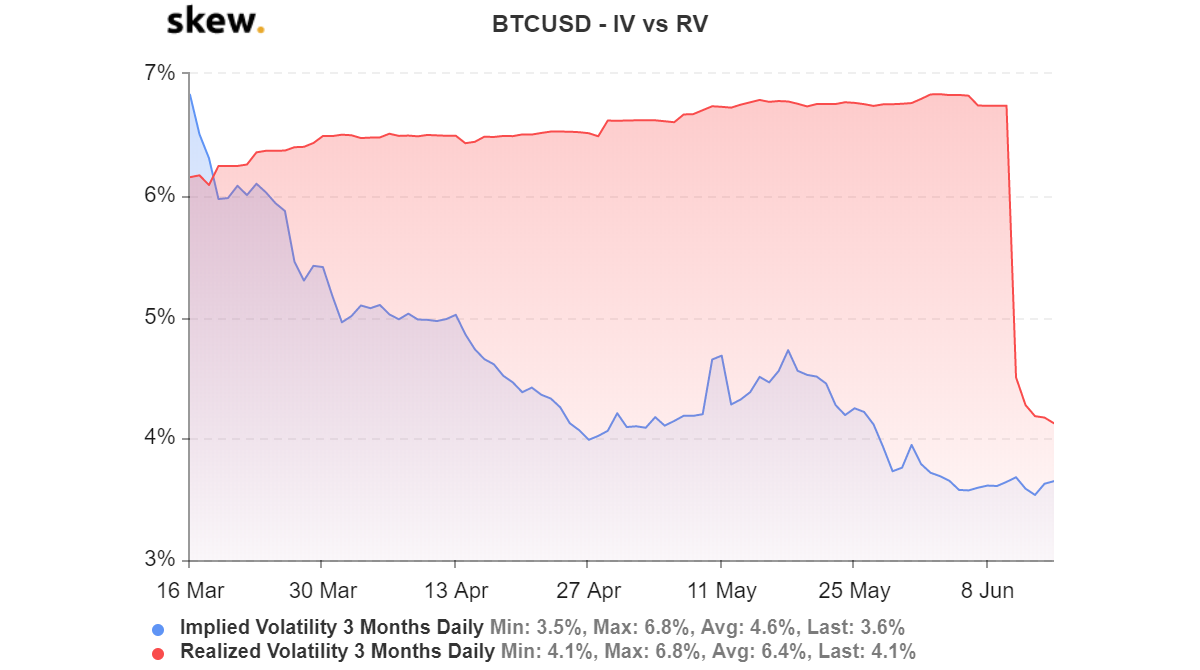
As can be observed from the two Skew charts of Bitcoin and Ethereum, the Realized Volatility for both crypto-assets dropped significantly over the past week. Bitcoin’s realized volatility dropped from a high of 6.7 percent on 10 June to 4.1 percent on 15 June. Interestingly, before the drop, Bitcoin was maintaining high RV levels above 6 percent.
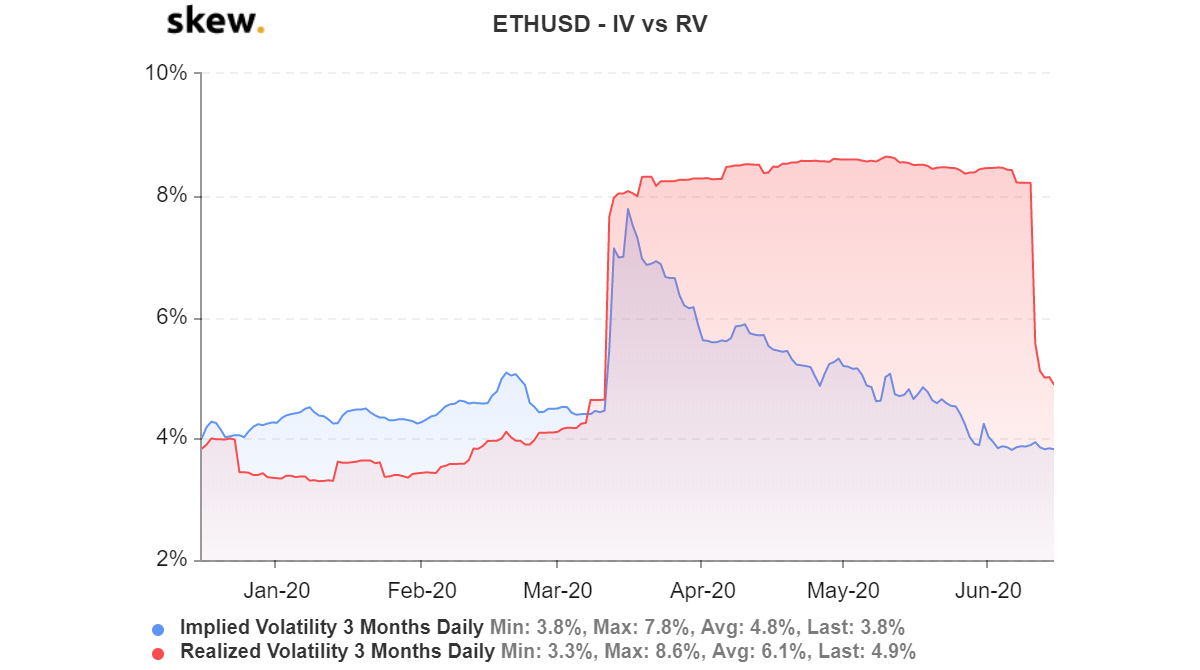
Similarly, Ethereum’s RV depreciated down to 4.9 on 15 June from a high of 8.4 percent on 11 June.
Is the drop in realized volatility indicative of a change in trend?
As already understood, realized volatility accounts for the volatile state registered by the crypto-asset over a period of time. The recent drop in RV for both Bitcoin and Ethereum means that it has fallen in line with their depreciating Implied Volatility on the charts, the latter of which has been evident for a while now.
However, the decline in Realized volatility might indicate two things going forward.
Firstly, for both Bitcoin and Ethereum, their respective valuation range might be a strong bottom over the course of 2020 and the tokens might build up from this base range over the next 6 months. Although there is no conclusive evidence for it, a similar situation had panned out towards the end of December 2019, a time when the RV for Bitcoin was lower than 3.5 percent. Back then, Bitcoin had been consolidating at a range between $6500 and $7000, from which the crypto-asset finally embarked on a bullish rally in 2020.
On the other hand, the RV might also suggest that buying pressure is finally exhausted in the present trend. Since the 3rd halving, Bitcoin has struggled badly to breach the $10,000 range, whereas Ethereum hasn’t been able to manifest a move above $250. Yearly highs exhibited in February 2020 stand tall, to date, and historically, July has been negative in terms of returns over the past 4 years.


Source: Skew


Source: Skew
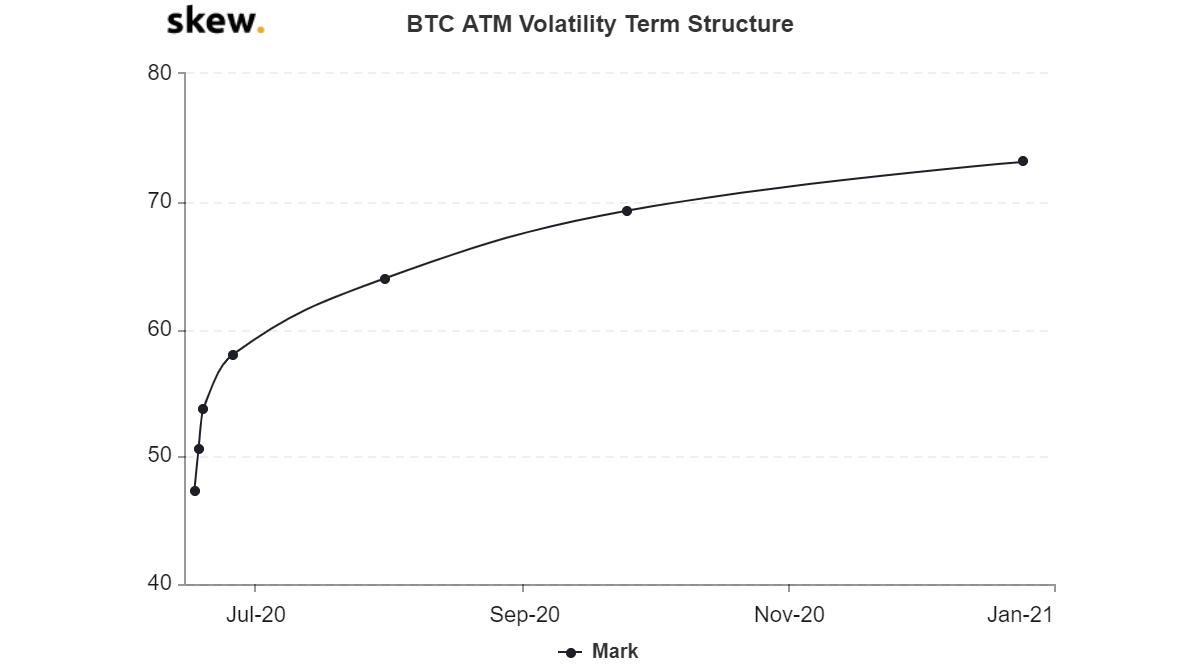
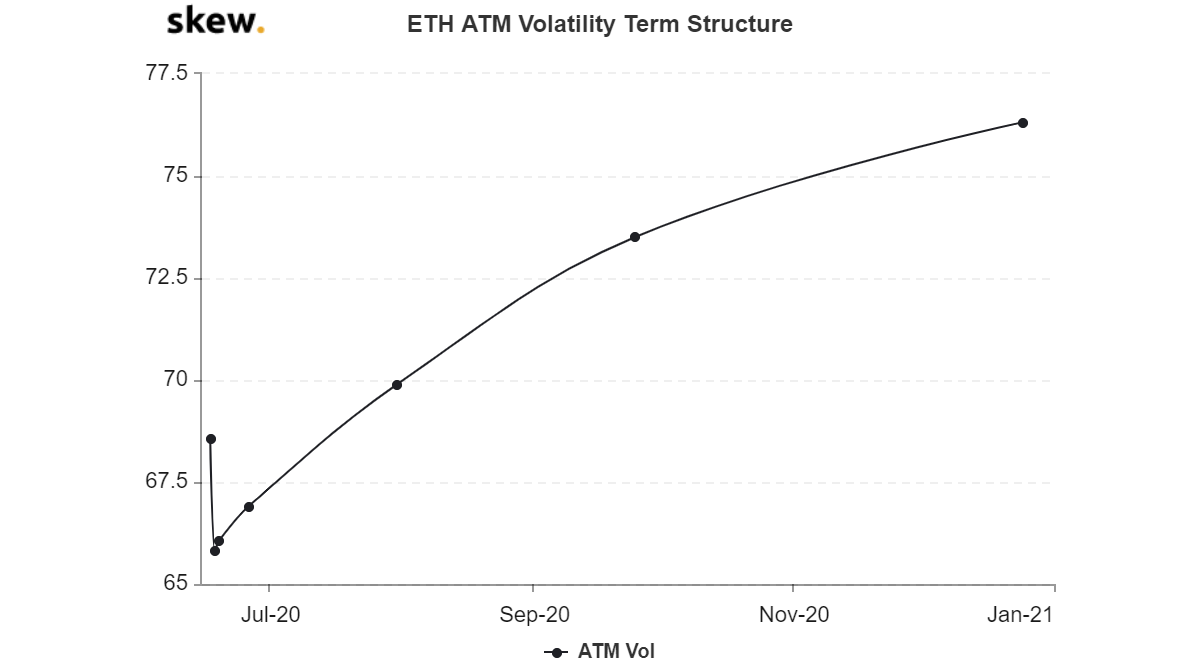
However, the last glimmer of hope for some definite price movement going forward was illustrated by Bitcoin and Ethereum’s volatility term structure. According to the chart, both the crypto-assets’ volatilities are supposed to start peaking from the start of July and continue all the way to December 2020.
Hence, the stage is possibly set for Bitcoin and Ethereum to undergo further corrections over the next few weeks, following which a bullish rally might surface in the industry.
Your feedback is important to us!


