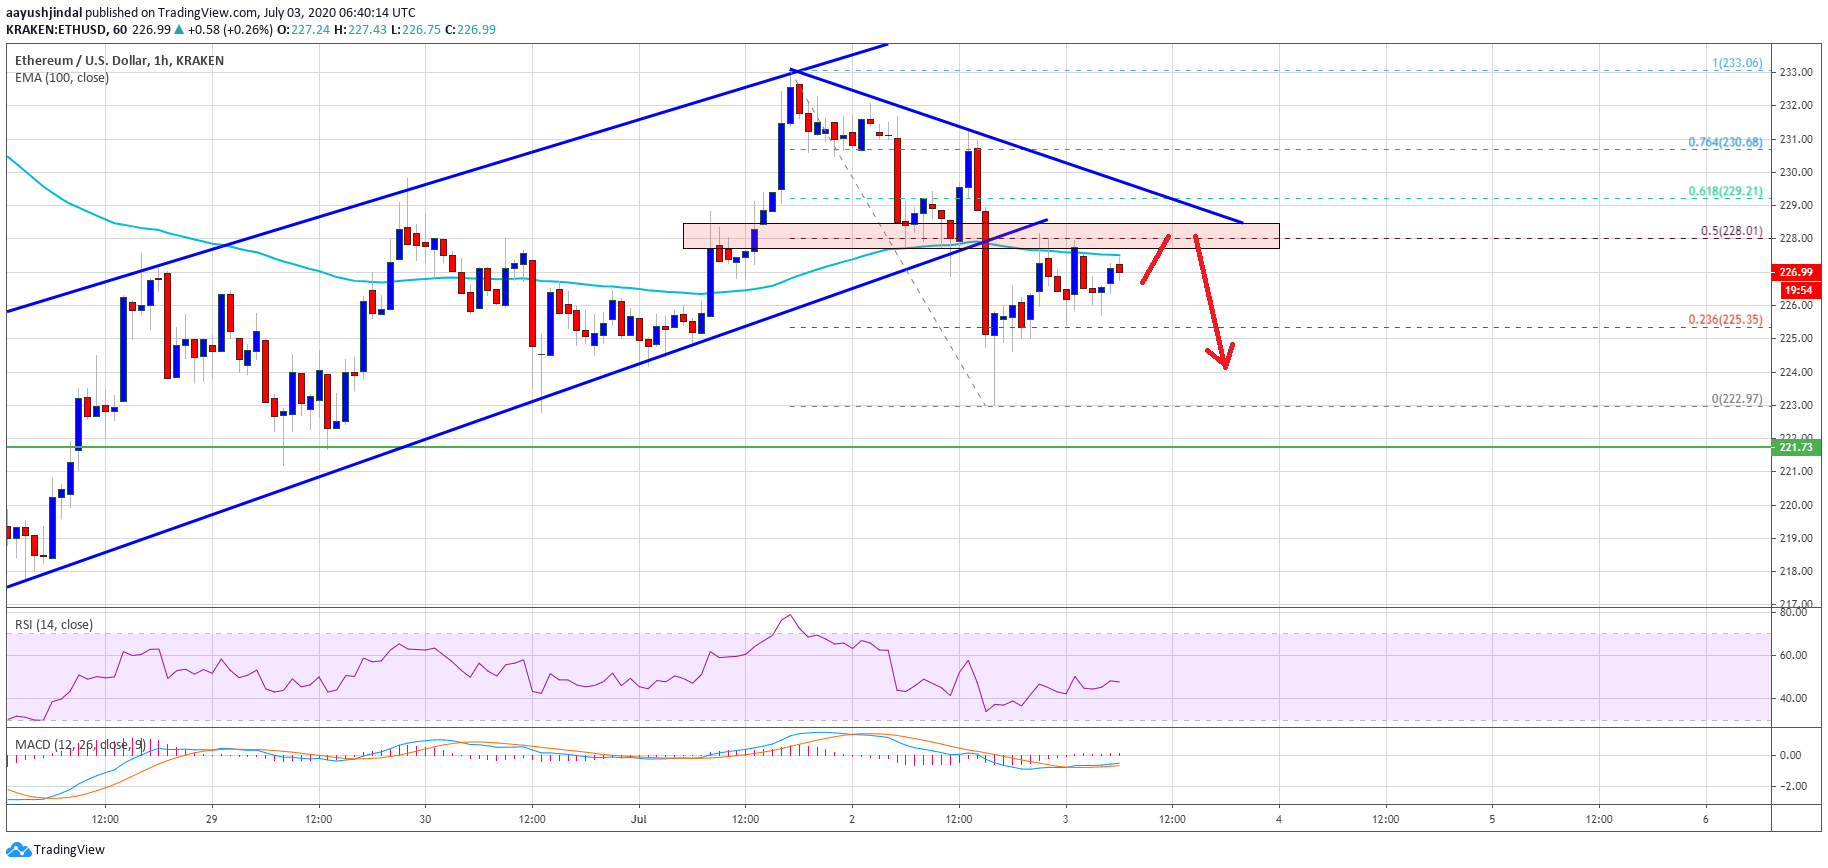
Ethereum failed to continue higher above $233 and declined sharply against the US Dollar. ETH is now trading below the 100 hourly SMA and it could continue to move down.
- Ethereum broke the key uptrend support level near $228 and the 100 hourly simple moving average.
- The price is likely to resume its decline unless it surpass the $228 and $230 resistance levels.
- The bulls failed to protect this week’s ascending channel with support near $228 on the hourly chart of ETH/USD (data feed via Kraken).
- The previous support at $228 is now acting as a strong resistance and preventing recovery.
Ethereum Price Support Turned Resistance
This week, Ethereum price climbed higher steadily above $220 against the US Dollar. ETH price even broke the $230 resistance yesterday along with the 100 hourly simple moving average.
However, the bulls failed to hold ground, resulting in a fresh decline from the $233 swing high. Ether declined sharply below the $228 support level and the 100 hourly SMA to move back into a short-term bearish zone.
The bulls also failed to protect this week’s ascending channel with support near $228 on the hourly chart of ETH/USD. The pair traded as low as $223 and it is currently correcting higher. There was a break above the 23.6% Fib retracement level of the recent decline from the $233 high to $223 low.
Ethereum price dives below $230. Source: TradingView.com
On the upside, the previous support near the $228 level and the 100 hourly SMA is acting as strong resistance. It is close to the 50% Fib retracement level of the recent decline from the $233 high to $223 low.
It seems like there is a crucial resistance forming near $228, $230, and a new connecting bearish trend line on the same chart. Ether price must break these three hurdles to start a fresh increase towards $232 and $235 in the coming sessions.
Another Drop in ETH?
If Ethereum fails to clear the $228 resistance and the 100 hourly SMA, it could resume its decline. An initial support is near the $225 level, below which the bears are likely to take control.
The main support is now near the $222 level. A successful break and close below the $222 support may perhaps spark another decline towards the $205 support in the near term.
Technical Indicators
Hourly MACD – The MACD for ETH/USD is losing momentum in the bullish zone.
Hourly RSI – The RSI for ETH/USD is currently retreating from the 50 level.
Major Support Level – $222
Major Resistance Level – $230
Take advantage of the trading opportunities with Plus500
Risk disclaimer: 76.4% of retail CFD accounts lose money.

