Like Bitcoin, Ethereum (ETH) has flatlined over recent weeks in an extremely tight range. For the leading altcoin, this range has been approximately $230-245.
Bears may soon gain the upper hand as the on-chain and technical analysis case for Ethereum has purportedly flipped bearish. This comes at a pivotal time for Bitcoin, which is expected to see a macro breakout in the coming week or two.
Related Reading: BTC Just Confirmed a Signal That Preceded Historical 5,000% Rallies
Ethereum Deposits Spike, Making An Analyst Fearful of a Drop
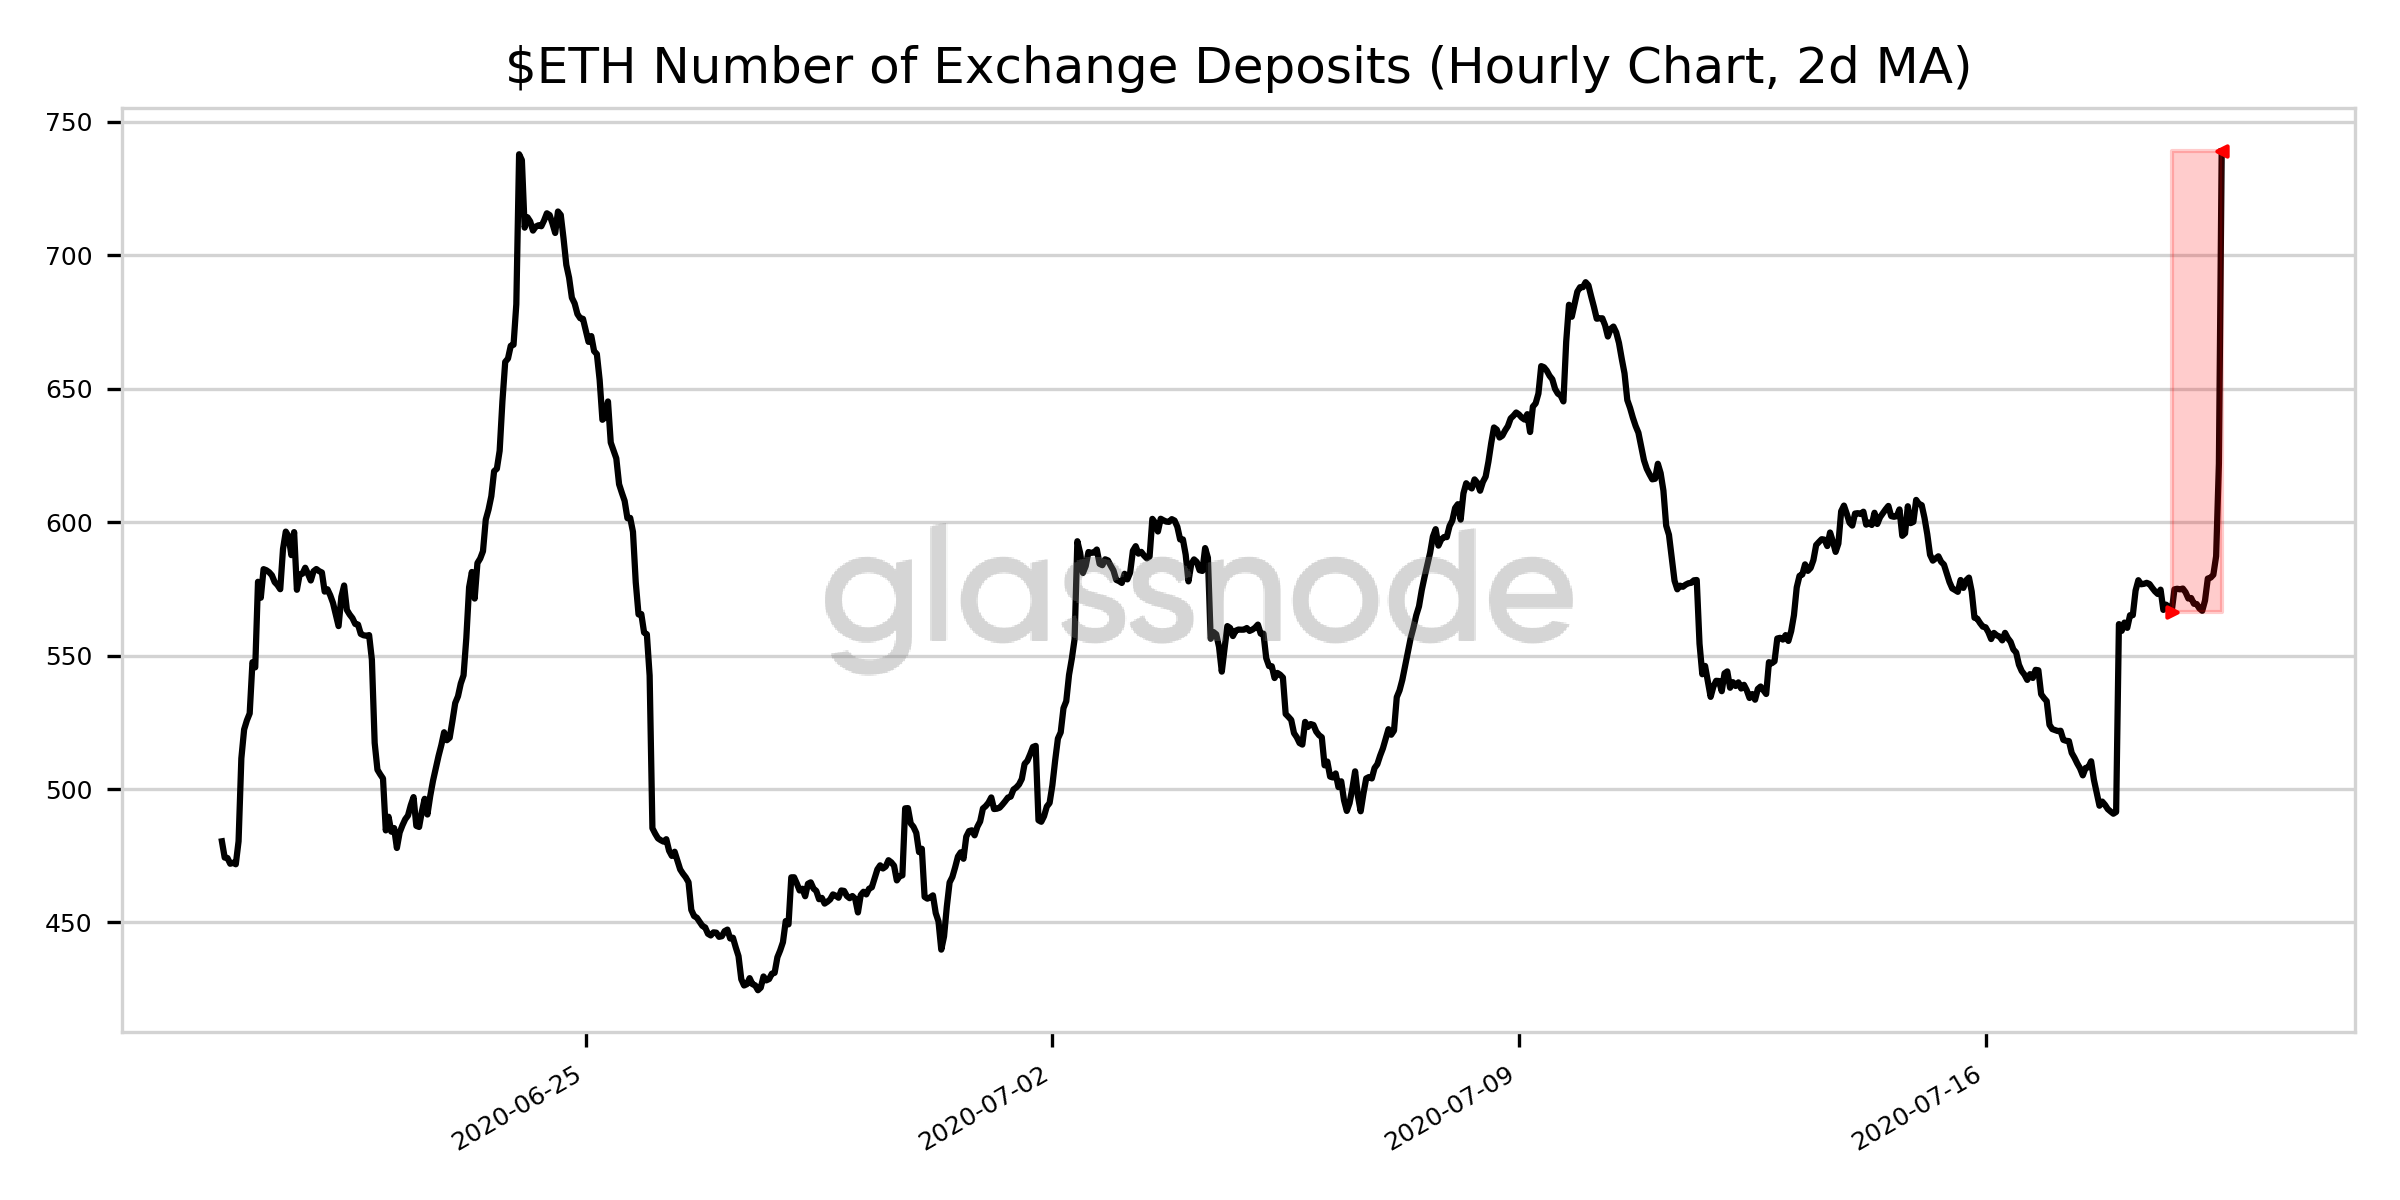
According to data shared by crypto analytics firm Glassnode, the number of exchange deposits has “increased significantly” over the past day.
Sharing the chart below, Glassnode noted that the two-day moving average of this metric has hit 738.938, up 30% from where this was yesterday. This is a multi-week high.
Chart of the number of ETH exchange deposits (hourly chart, 2-day moving average) from Glassnode Alerts (@GlassnodeAlerts on Twitter)
One trader says that this may be a bearish sign for Ethereum. After all, an increase in deposits into exchanges suggests the ETH will be sold for another asset.
“F**k. Unless these are going into defi alts, this is prob not bullish lmao,” one trader commented on the on-chain trend.
Another market commentator added that there’s likely a low probability these coins will be used to buy DeFi altcoins due to decentralized exchanges.
Adding to the seeming implications of this on-chain metric, there’s also purportedly a technical bear case for the asset.
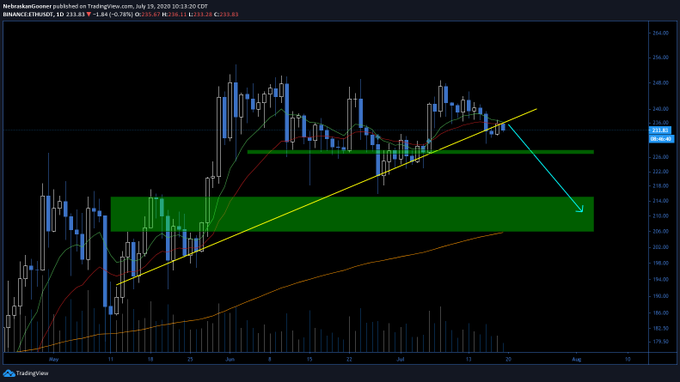
One cryptocurrency trader shared the chart below on Jul. 19. It shows that Ethereum recently lost a crucial diagonal support and is now trading under key moving averages. To him, this weakness suggests that a retracement towards $206-215 will take place in the coming weeks.
Chart of ETH’s price action from TradingView.com. Analysis by trader “Nebraskan Gooner” (@nebraskangooner on Twitter)
Another trader has echoed this sentiment, recently writing that it is “Time to go swing short on ETH.” He attributed this sentiment to a technical reason similar to the one mentioned above: ETH has lost technical supports.
Part of the DeFi Boom
Although the trader is fearful of a drop that may come from these deposits, there’s remains a probability that this Ethereum is part of the ongoing DeFi boom.
It isn’t clear what the intracacies of Glassnode’s data are, such as where the coins were deposited and in what quantity. But, CoinGecko indicates that some of Binance’s top trading pairs over the past 24 hours have been for decentralized finance coins. This may suggest that there has been an influx of buying pressure for altcoins from traders.
Related Reading: Crypto Tidbits: Twitter’s “Bitcoin Scam,” Elon Musk & Dogecoin, Institutions Want BTC & ETH
Featured Image from Shutterstock
Price tags: ethusd, ethbtc
Charts from TradingView.com
Analyst Fears a Drop as Ethereum Deposits Spike to Multi-Week Highs


