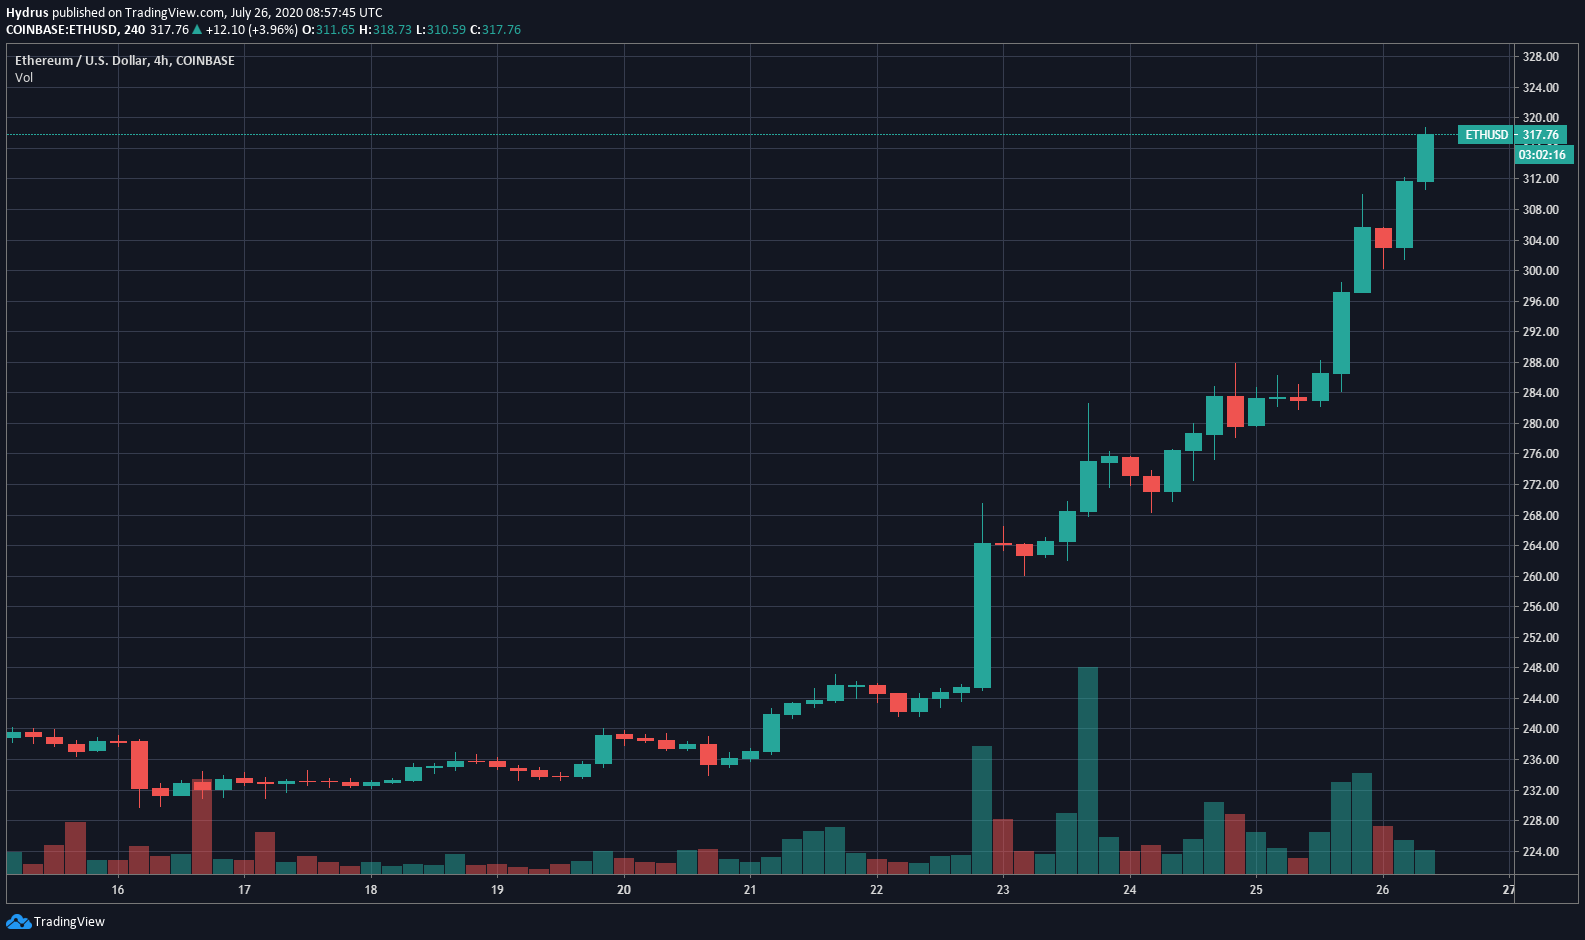
Ethereum is ripping higher after having broken past the pivotal $250 resistance earlier this week. As of this article’s writing, the asset trades for a few dozen basis points shy of $320 — a price almost 30% higher than that of five days ago.
ETH’s latest leg higher has brought it to a new year-to-date high. Earlier this year, in February, the asset topped at around $290 before proceeding to plunge to $88. This latest move, then, has been a breath of fresh air for bulls.


Chart of ETH's price action over the past few days from TradingView.com
Many investors have been caught off guard by this move. Just days ago, the asset was stuck under $250 as it failed to benefit from the then-ongoing small-cap altcoin surge.
Though analysts are trying to determine what comes next for Ethereum, which remains down almost 80% from its all-time high.
Ethereum Is Printing Reversal Signs
Ethereum is printing potential reversal signals after surging 30% in five days, analysts have said.
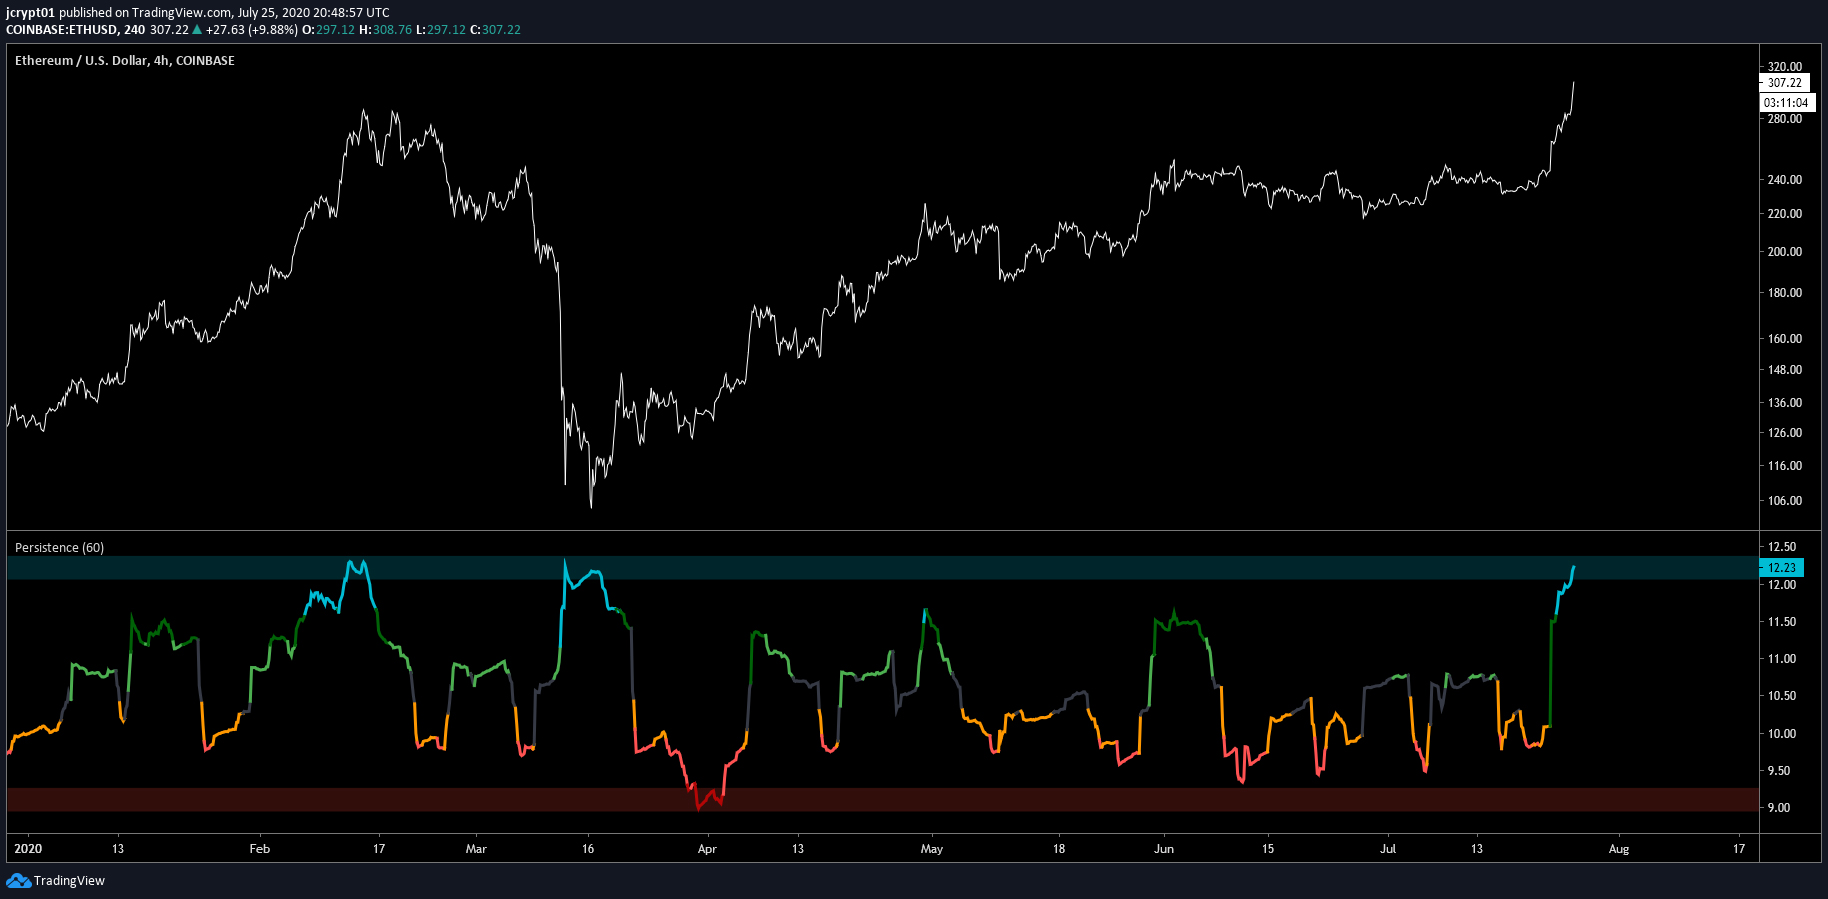
One trader shared the chart below, noting that Ethereum looks similar to how it did at the February top from the perspective of a trend indicator:
“Watch for a local top on $ETH based on 10 day trend persistence.. highest in Feb was 12.30, March dump highest was 12.25, we are currently at 12.21.”
Chart of ETH’s price action since the start of the year with Persistence indicator from trader Joseph (@Josephcrypto on Twitter). Chart from TradingView.com
Other signs have also indicated that the asset is extremely overextended.
One trader shared that per the Bollinger Bands, a prominent technical indicator that tries to define ranges/volatility for an asset, ETH is overextended:
“You may very well have a strong FOMO that you don’t own enough ETH right now but look at the Bollinger Bands, daily completely outside of it. High chance it goes back inside the channel over the next week.”
That same individual added a few moments later that Ethereum’s current price action looks structurally similar to 2019’s highs. “We slightly overran yearly pivot R last year and we just did so now… Pretty confident I’ll be able to buy back a bit lower.”
Don’t Fade the Rally Long Term
Although most agree that Ethereum may see a short-term drop, a large convergence of analysts remain certain that it is long term in an uptrend.
One top trader commented that he is not “fading this,” referencing how Ethereum decisively set a macro higher high for the first time in around three years.
Others have noted that because Ethereum breached a macro resistance at $290-300, it is primed to surge towards the $500s and beyond.
Featured Image from Shutterstock
Price tags: ethusd, ethbtc
Charts from TradingView.com
Ethereum Hits $320 as Price Goes Parabolic: What Analysts Think Comes Next

