Chainlink’s recent price action closely resembles a sharp pullback in Ethereum in 2017 during the crypto market bull run. If the booming decentralized oracle token continues to follow the top altcoin’s previous trajectory, $75 per LINK token might be possible as its next major peak.
Chainlink Price Action Matches Another Top Altcoin’s Crypto Bubble Momentum
The last two years of a bear market has decimated crypto market valuations, except for Chainlink. The cryptocurrency was born post-bubble pop, resulting in a clean slate over the last two years that have helped keep it climbinging value.
The altcoin was the best performing digital asset last year, seemingly immune to bearish drawdowns powerful enough to take down the likes of Bitcoin and Ethereum.
Related Reading | Chainlink Bull Flag Breakout Could Target $25 By Year’s End
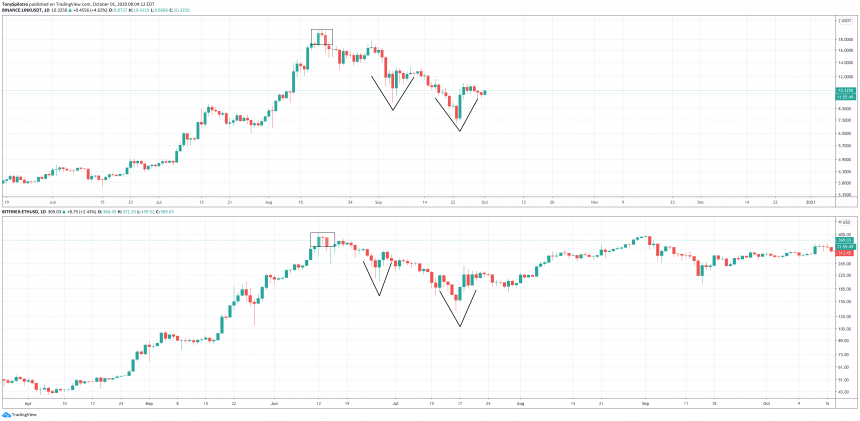
In 2020, Chainlink entered price discovery mode, much like crypto tokens of 2017 did and it was sent soaring to highs five times the previous peak. After that parabolic climb that may arguably still be intact, LINKUSD saw a steep, 60% crash.
But at the bottom of the fall, two sharp V-shaped recoveries took place, one failed, and one holding so far. Interestingly, these deep dives following new highs closely match the stand out star of the last bull run: Ethereum.


LINKUSDT 2020 Versus ETHUSD 2017 Comparison Chart | Source: TradingView
Ethereum’s ICO-Fueled Rally Mimics LINKUSD’s Rise To Stardom
The price action matches between 2017 Ethereum and 2020 Chainlink almost perfectly. A bull flag breaking up started leg two of two major rises.
At the peak, the same exact evening star pattern reversed the trend from bullish to bearish, sending each altcoin asset crashing to support.
Related Reading | This Chart Suggests Chainlink’s Parabolic Rise Isn’t Finished
The first support attempt and V-shaped recovery ultimately broke down further, leading to another successful attempt by bulls.


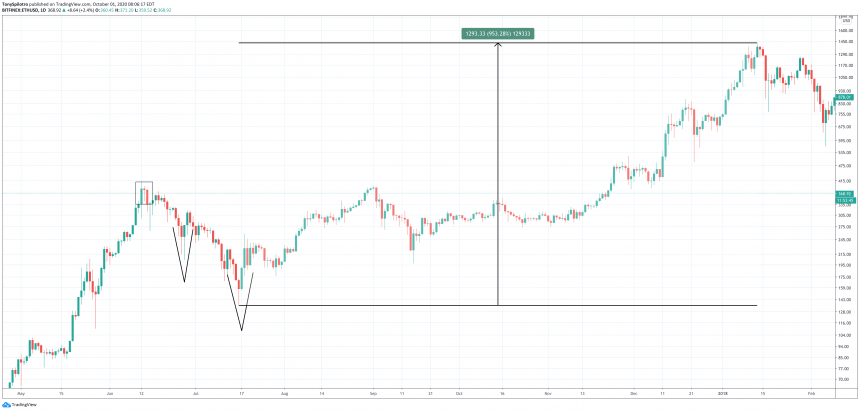
ETHUSD Daily What Happened After The Bounce: 950% Rally | Source: TradingView
From that low in Ethereum in 2017, the top-ranked altcoin fueled by the ICO boom went on an over 950% tear to its all-time high of $1,400 per ETH token.
If Chainlink follows the same path, with the same ROI from the second V-shaped low, the asset would reach a price of $75 per LINK token. And while there’s no ICO boom this time around, Chainlink’s use as a decentralized oracle solution makes it central to the growth in the DeFi space.
Not only is Chainklink possibly looking for continuation from a technical perspective, but fundamentals are also only getting healthier, and demand is only growing for the altcoin.
Featured image from Deposit Photos, Charts from TradingView
