- Ethereum’s 3-month correlation with Bitcoin has hit a 10 month high
- The increased correlation comes after last month’s Bitcoin dip to $30k that shook the crypto-verse
- ETH/BTC daily chart hints of Ethereum attempting to break free from the influence of Bitcoin at least in the short term
- However, 0.08 BTC might prove to be a difficult hurdle for Ethereum moving forward
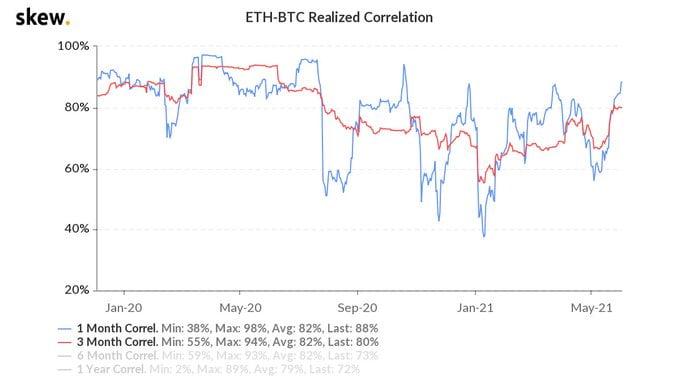
Ethereum’s three-month correlation with Bitcoin has hit a 10 month high. The increased relationship between Ethereum and Bitcoin was identified by the team at Unfolded who shared their observation through Twitter. Their analysis included the chart below which demonstrates the increase in Ethereum‘s correlation with Bitcoin in the last few weeks.
Bitcoin Dips to $30k, Ethereum Dips to $1,728
From the chart above, it can be observed that Ethereum’s correlation to Bitcoin started rising in the middle of May immediately after ETH started to pull back from its all-time high value of $4,372. The pullback was the result of Ethereum being in overbought territory as well as Bitcoin undergoing its own pullback worth 50% that sent BTC to a local low of $30k.
Consequently, Ethereum dropped by 60% in 2 weeks to a local low of $1,728 and is currently trading at $2,728. Ethereum is attempting to break the crucial $2,800 resistance level that has converged with the 50-day moving average on the ETH/USD chart. The latter price area will determine whether Ethereum returns to bullish territory above $3k.
ETH/BTC Pair Hints of Ethereum Once Again Outperforming Bitcoin in the Month of June
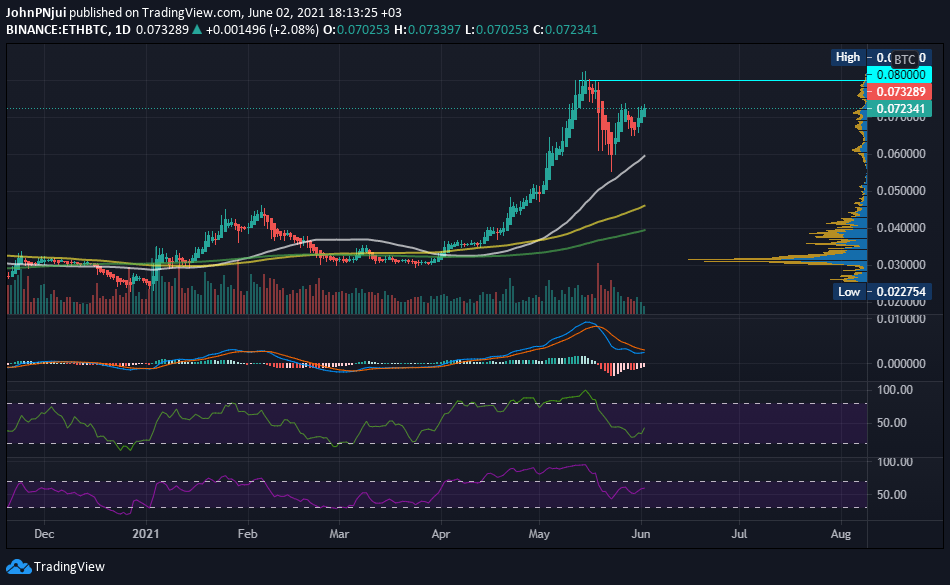
A quick glance at the current daily ETH/BTC chart below reveals that Ethereum is once again attempting to break free from the influence of Bitcoin as it did in the months of April and May. From the chart, the daily MACD, RSI and MFI are hinting at Ethereum pushing towards the 0.08 BTC resistance level in the days to follow.
However, if Ethereum keeps gaining against Bitcoin, the aforementioned 0.08 BTC resistance area will be a tough one to crack for ETH as it is close to the 3-year high of 0.0824 BTC. Also to note, is that the trade volume of ETH/BTC pair has been on a decline since mid-May, indicating a slowdown in buying demand for Ethereum.
Therefore, caution is advised when trading the ETH/BTC pair moving forward as Bitcoin’s dominance might once again be asserted in the near future.
Trading of the ETH/USD pair might be a safer route given the higher probability of Ethereum breaking $3k as compared to ETH breaking 0.08 BTC.


