In brief:
- The DeFi token of Aave (AAVE) is up by over 18% in the last 24 hours
- The double-digit increment in value comes in the backdrop of Aave’s V3 upgrade
- With the newest upgrade, users of Aave will enjoy cross-chain transactions, higher efficiencies, new wallet integrations and more
- AAVE is also exhibiting some bullish momentum on the daily chart
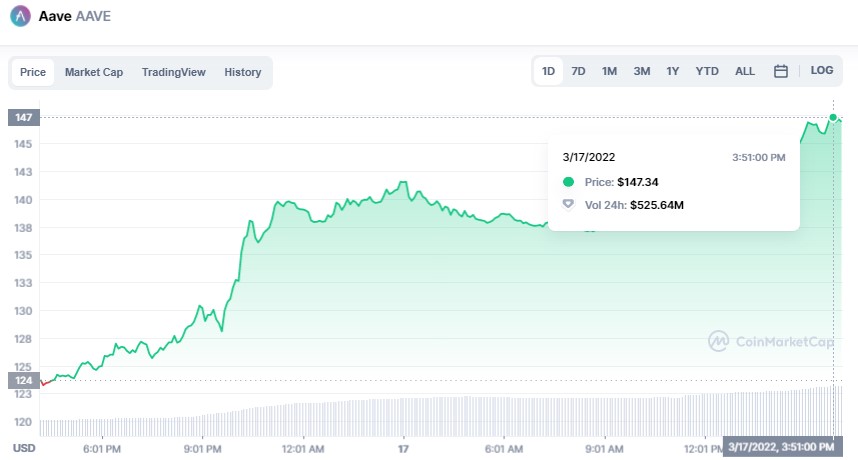
The DeFi blue-chip token of Aave (AAVE) is up by over 18% in the last 24 hours.
According to Coinmarketcap, Aave (AAVE) opened the day at around $124 reaching a local peak of $147.34 only moments ago. This translates to an 18.82% increment in value by Aave (AAVE) in a day.

Aave Protocol Upgraded to V3
AAVE’s impressive 24-hour performance comes at the backdrop of the release of the protocol’s V3 upgrade that was implemented yesterday, March 16th.
V3 is the most powerful, advanced, secure and efficient version of the Aave Protocol to date.
It features the following groundbreaking new features.
- Portals – that offer ‘bridge’ protocols voted by Aave governance. These portals facilitate cross-chain transactions
- A high-efficiency mode – also known as ‘E-mode’ that allows users to have access to higher borrowing power within the same asset category
- Isolation mode – which will allow users to only borrow assets of a particular type and cannot simultaneously use other assets as collateral. Isolation mode limits exposure and risks to the protocol from newly listed assets
- L2 features to improve user experience and reliability
- Gas optimization – reducing gas costs of all functions by 20 – 25%
- Community contribution – which facilitates and incentivizes community usage through a modular, well-organized codebase
- Additional risk management improvements that reduce Aave’s exposure
- New wallet integrations and access points such as InstaDapp, DeBank, 1inch, Paraswap, Zapper, DeFiSave, Zerion, just to name a few
Aave (AAVE) Continues to Hint of Bullishness on the Daily Chart
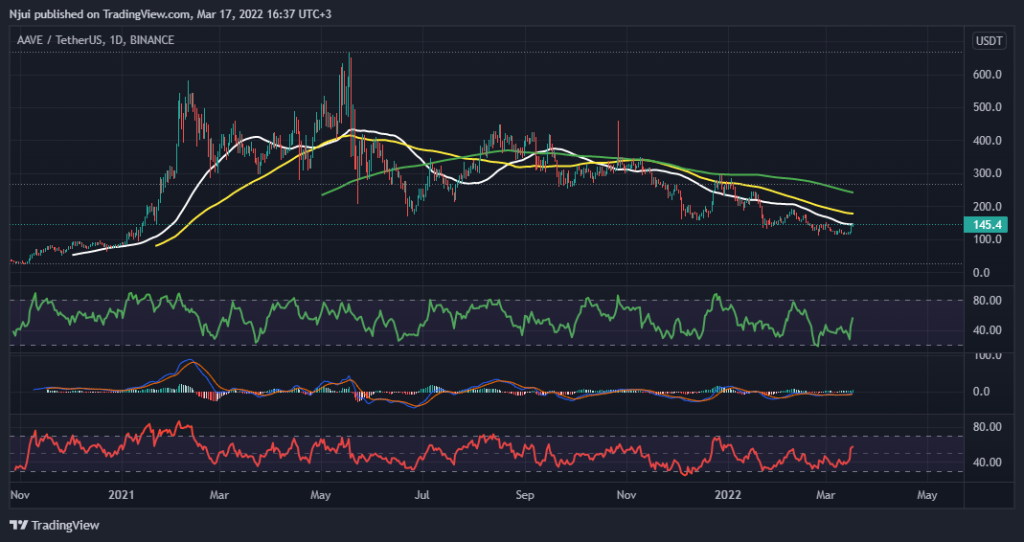
As to whether AAVE’s current bullish momentum can be sustained, the daily chart below indicates potential for more growth in the days to follow.
From the chart, it can be observed that AAVE/USDT is battling to recover from a downtrend that began after hitting its all-time high of $668 set in May of last year.
The DeFi token is also battling to turn the 50-day moving average (white) as support at the $145 price area. Additionally, the daily MFI, MACD and RSI hint towards a continuation of buying for the rest of this week.
However, the 100-day moving average (yellow) and the 200-day moving average (green) offer areas of considerable resistance for AAVE at $180 and $240 respectively. A complete recapture of the 200-day moving average will most definitely confirm a recovery of AAVE/USDT in the crypto-markets.

