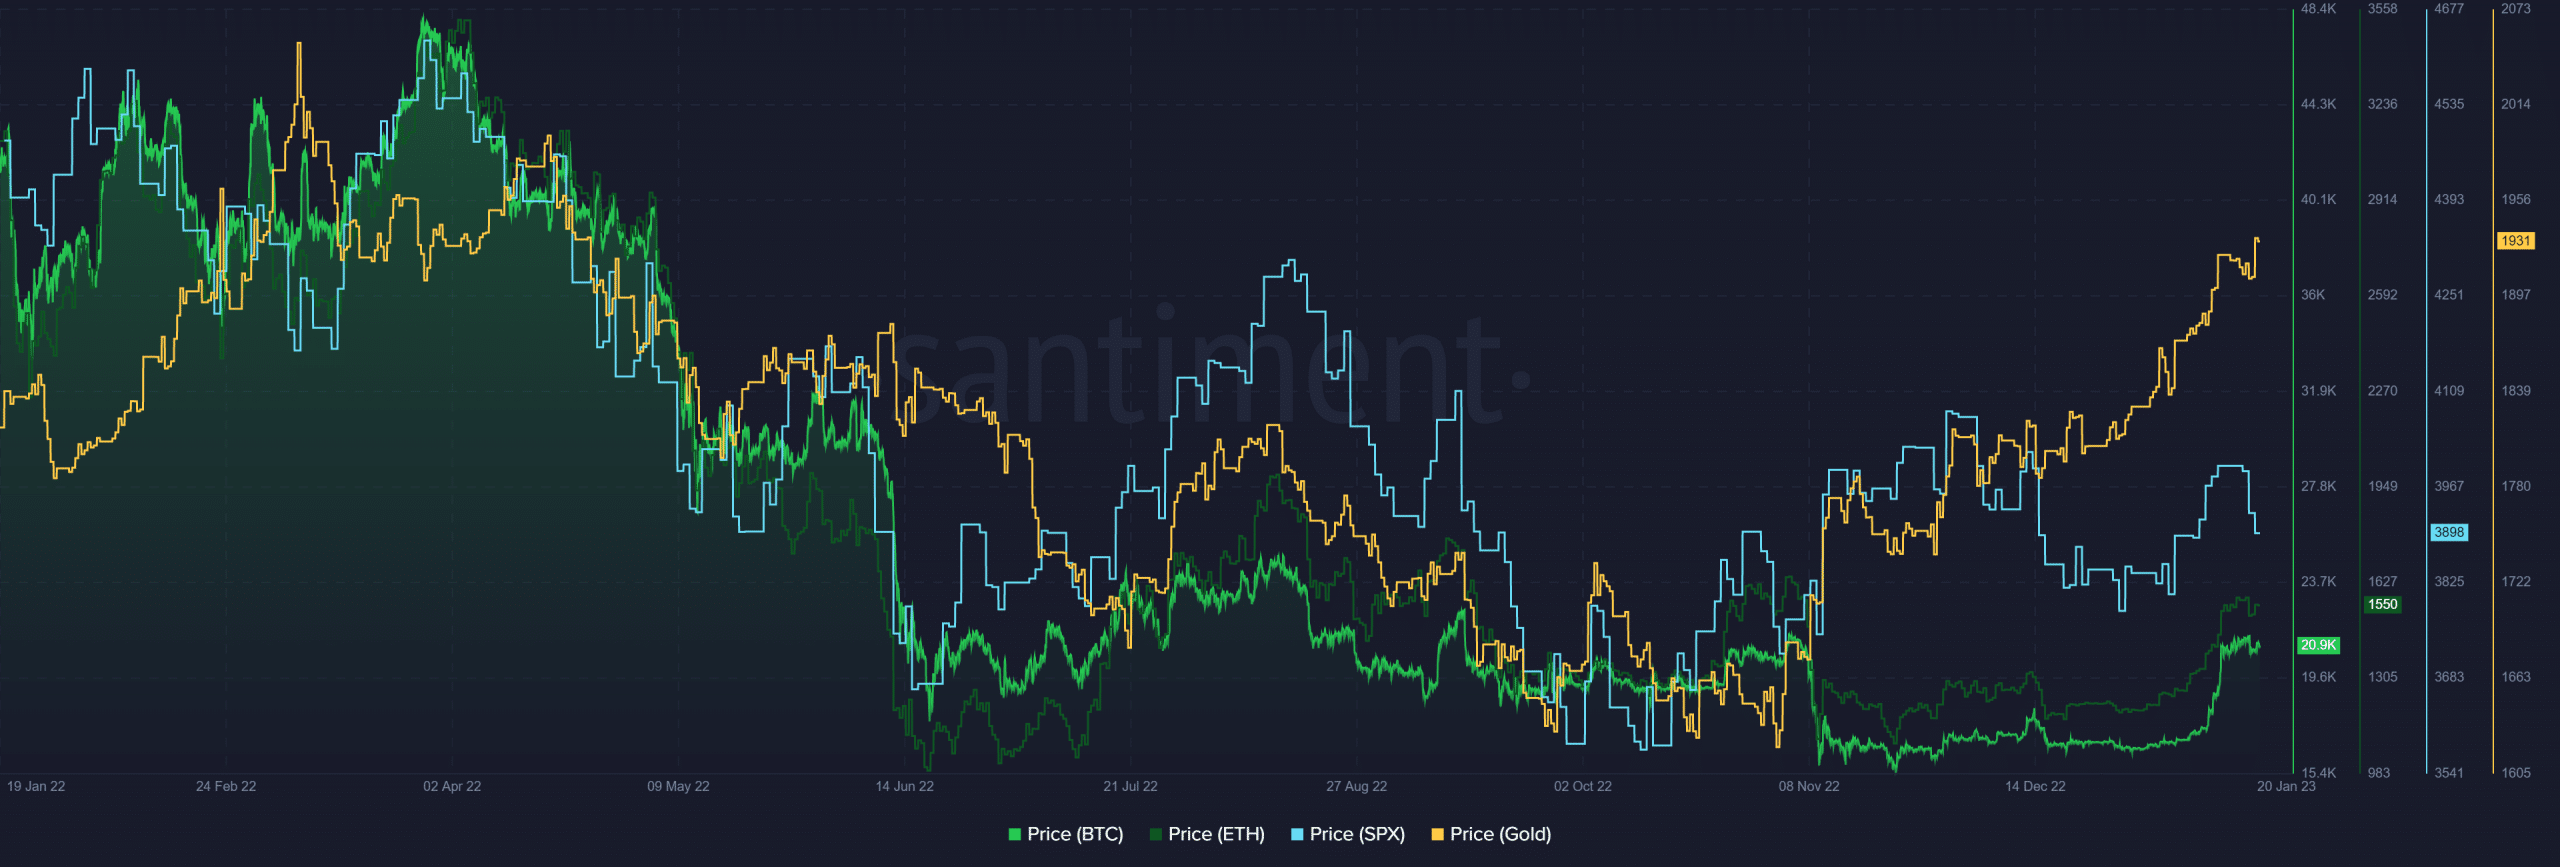
- The S&P 500 metric showed a price correction while Ethereum continued an uptrend.
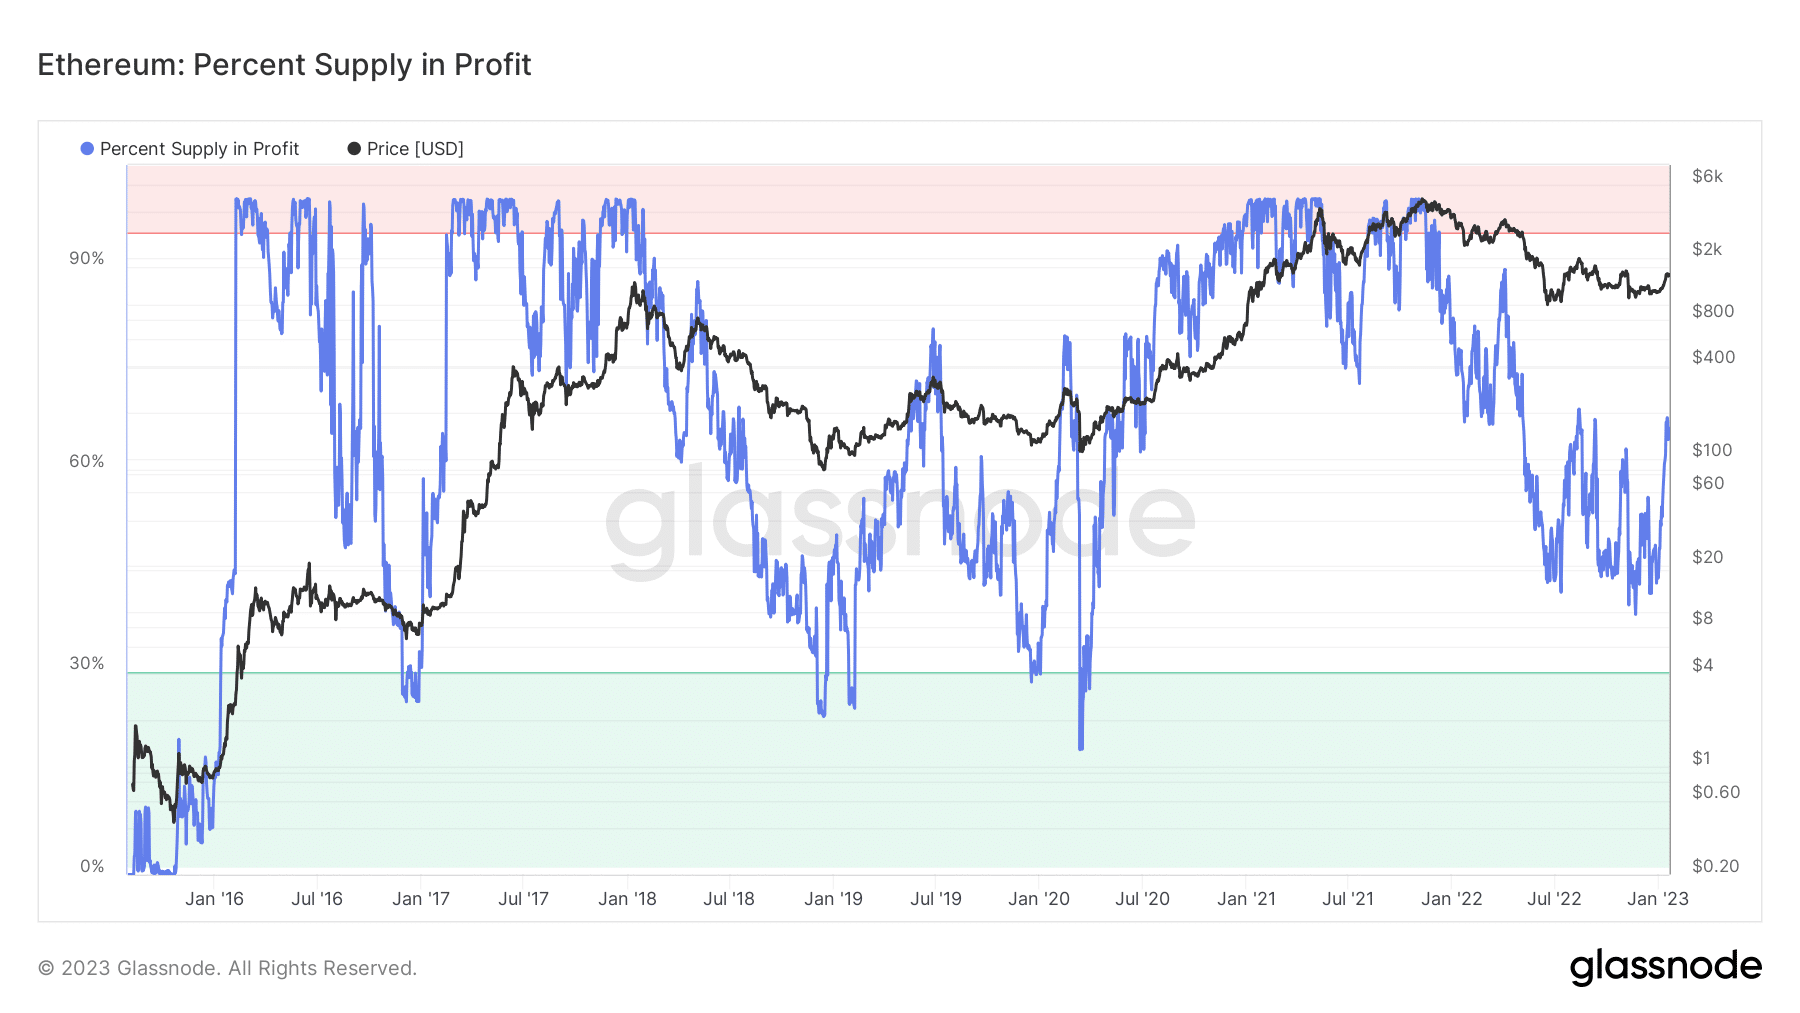
- Percent Supply in Profit was over 67% at press time, representing a four-month high for Ethereum.
The price of Ethereum [ETH] rose dramatically over the last few days, which indicated a bull trend. Consequently, the recent activity of the S&P 500 metric and its correlation with crypto may provide some indication as to the same.
Read Ethereum’s [ETH] Price Prediction 2023-24
Ethereum and equity prices go in opposite directions
Recent information indicated that Ethereum’s price was trending opposite to the S&P 500. Per Santiment’s data, at press time, the price of the S&P 500 index underwent a correction following its previous rising trajectory.
When the S&P 500 (a proxy for equities) and cryptocurrency show no relationship to one another, a bull market is said to have begun.
The Standard & Poor’s 500 (S&P 500) measures the collective stock market performance of 500 of the largest publicly traded corporations in the United States. The index components are chosen by Standard & Poor’s, an S & P Global division, and broadly represent the U.S. stock market.
Percent Supply in Profit hits four-month high
Besides the stock market’s movement, the percentage of supply in profit is a leading sign of an Ethereum bull run. Over 67% of the Percent Supply was profitable, as evidenced by data from Glassnode.
The graph also showed that the present level of the Percent Supply in profit was at its highest in four months. The significance of this statistic in evaluating the Ethereum bull run is that the greater the Percent Supply in profit, the more likely a bull run is in play.
MVRV shows reduced loss
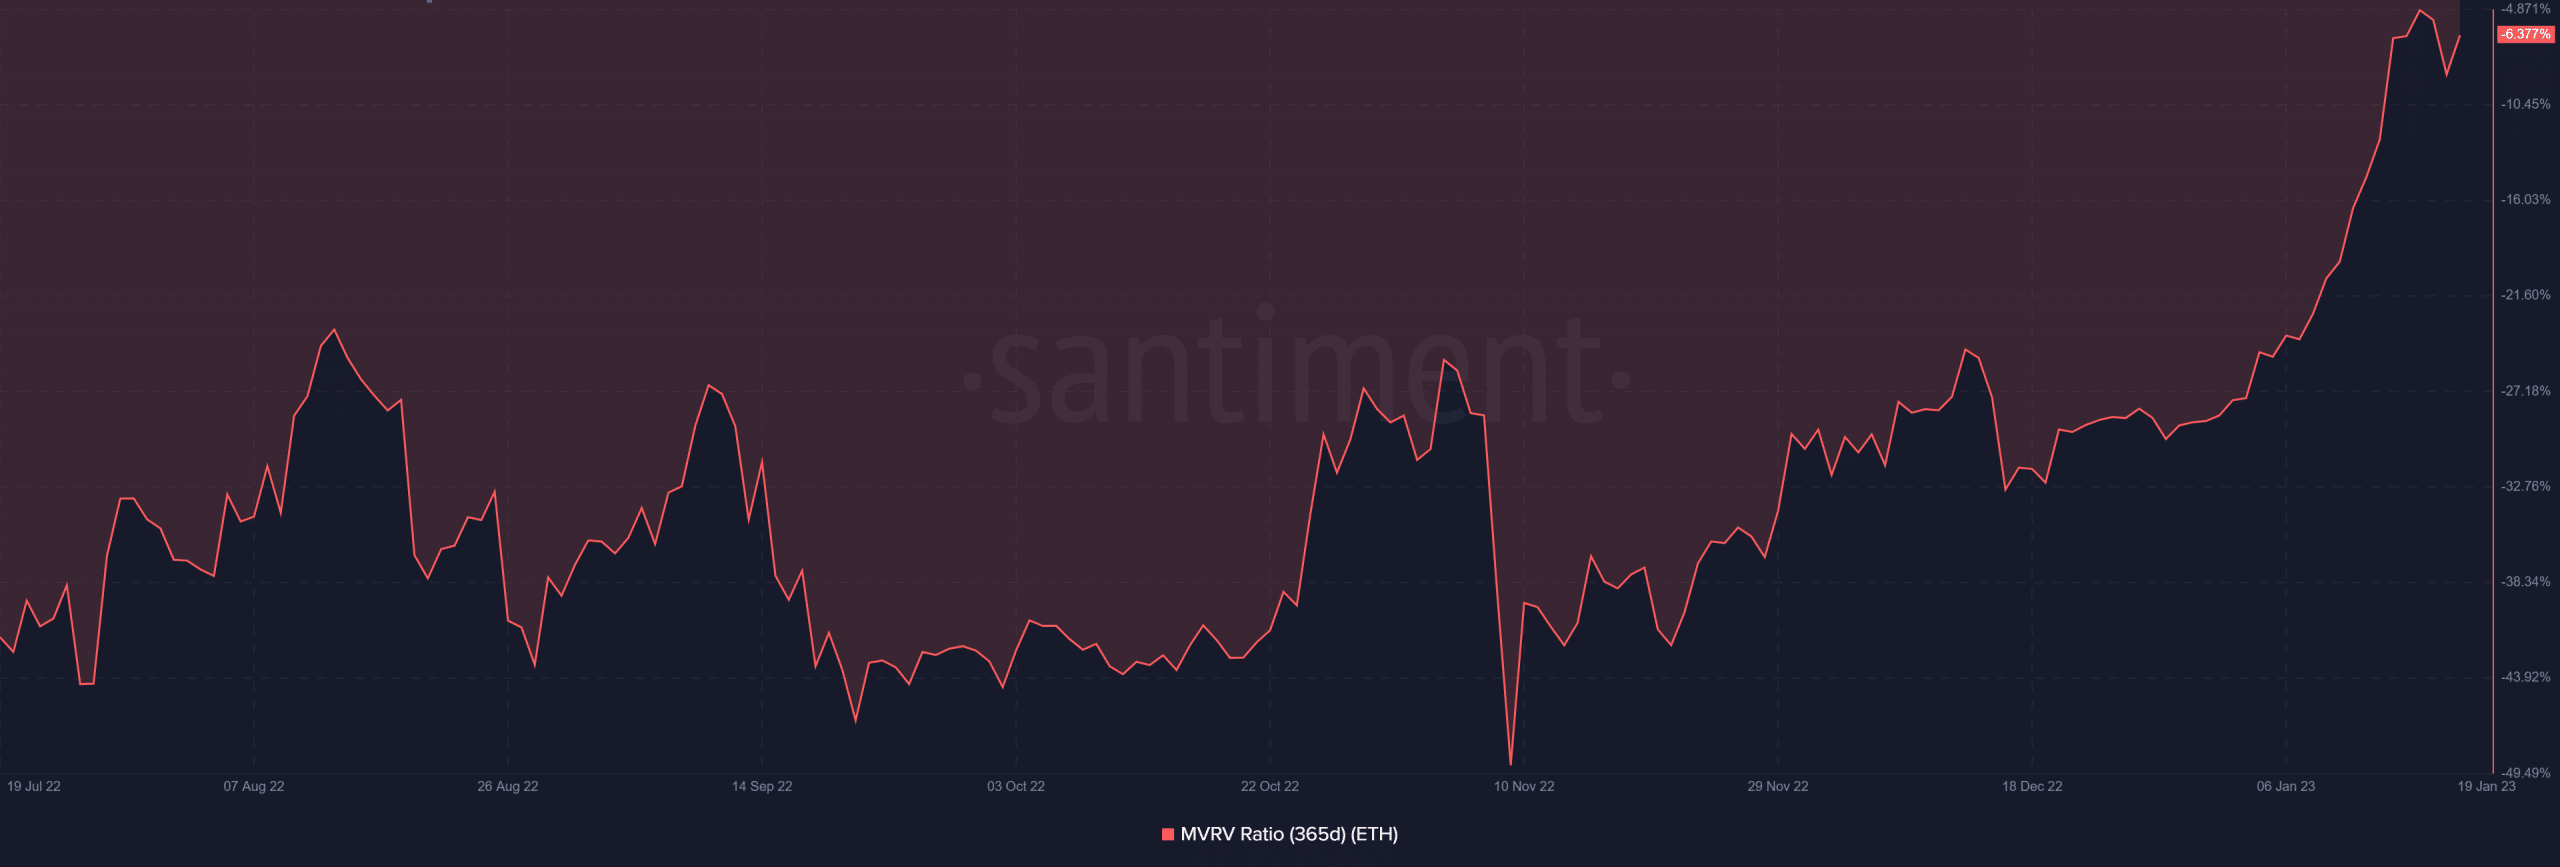
When the 365-day Market Value to Realized Value (MVRV) ratio is included, the case for a bull market becomes stronger. The MVRV ratio was roughly 6.3% at the time of writing. The current MVRV level indicated a 6% decrease in the value of Ethereum.
Though a loss, the stretch to recoup the earlier loss suggested a bull market. However, it would be a complete run when it turned the holdings in the 365-day period into profit.
Is your portfolio green? Check out the Ethereum Profit Calculator
Ethereum remains in the overbought zone
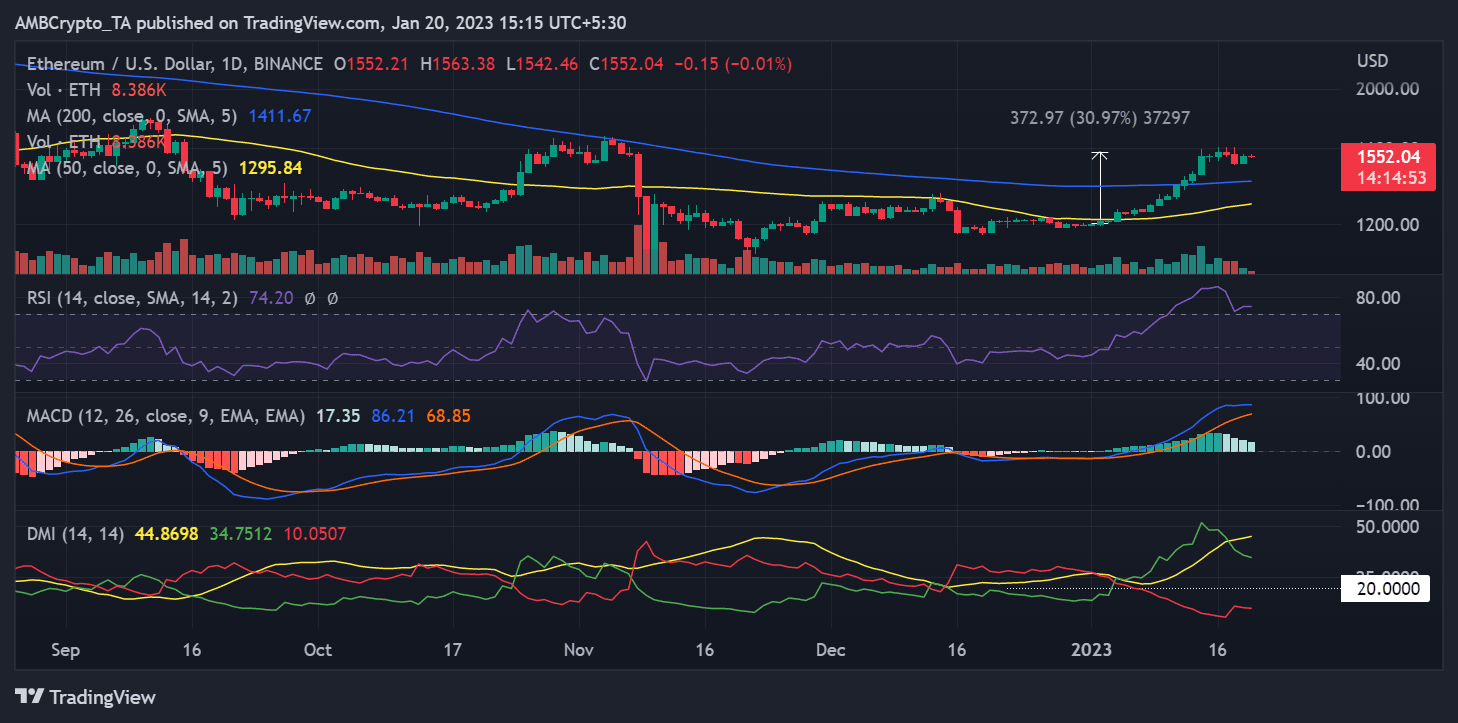
A daily timeframe chart of Ethereum’s price showed that it was trading near $1,550 as of this writing. The current price region represented a gain of nearly 30% at press time, as calculated using the Price Range tool.
Furthermore, Ethereum’s Relative Strength Index (RSI) readings indicated that the price was relatively stable in the overbought territory.


