In a recent post, investor Chris Burniske expressed the belief that a bottom is looming for the top cryptocurrencies. Burniske predicts that Bitcoin and Ethereum could dip as low as $20,000 and $1,000, respectively, with top altcoins, except Solana (SOL), hitting new lows.
Notably, BTC retraced from $28,000 to slightly above $27,600, with ETH seeing a similar decline in the past few days.
Crypto Analysts Predicts Market Bottom Ahead Of Bull Run
According to the founder of Placeholder Capital, Chris Burniske, a bull market will likely begin soon. However, the analyst believes the upcoming bull run will be preceded by a bottom cycle in the present financial quarter (Q4 2023). Furthermore, Burniske believes that this bottom will lead to declining crypto prices.
According to his analysis, fear is high but only temporarily, as sellers are exhausted. Burniske believes the predicted lows for the top cryptocurrencies will present attractive buying opportunities in preparation for the upcoming bull market.
Fear is high, but temporally and price-wise, selling exhaustion is near imo. Sure $BTC could go to low $20Ks & $ETH to low $1Ks & most everything long-tail (except $SOL) can hit new lows, but when we look back on Q4 2023 & Q1 2024 it’ll be clear it was a good time to be a buyer. https://t.co/I6hpKCw1Q8
— Chris Burniske (@cburniske) October 4, 2023
The crypto analyst supported his predictions with Linear charts, stating that it is easy to spot tops and bottoms with such charts. For context, Linear charts show the change in the price of an asset. Burniske believes it is up to traders to choose their accumulation style with patience and persistence.
What Lies Ahead For Bitcoin And Ethereum?
Bitcoin trades at $27,697, with a 0.56% price increase in the last 24 hours. Ethereum’s, on the other hand, is $1,639, with a 0.45% 24-hour decline.
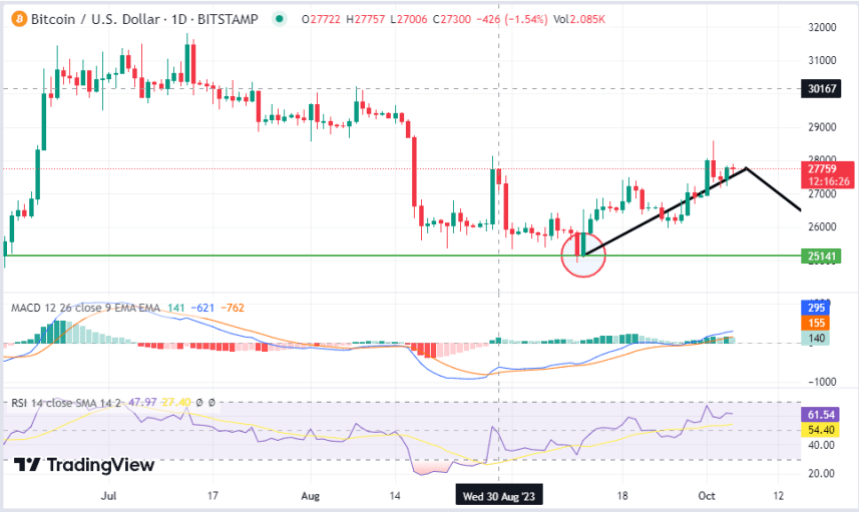
Meanwhile, BTC has encountered stiff resistance at $28,000, leading to a decline to $27,000 in the last few days. The asset formed a bottom on the daily chart on September 11 before the buyers forced a price recovery.
Although BTC recovered slightly, the sellers have continued to re-enforce the $28,000 resistance. If the selling pressure increases, a decline to the $25,141 support level is possible in the coming days.

Moreover, the green MACD Histogram bars have faded, confirming a drop in buying pressure as sellers reclaim dominion. Also, the RSI is dropping from the buy zone and displays a value of 61.54.
If the RSI drops below 50, BTC may resume the downtrend in the coming days. If Bitcoin drops further, a bottom cycle will likely begin in the crypto market.
The potential decline to the $25,142 support level could facilitate a bull cycle. The reason is that it presents an attractive entry level for the accumulation phase.
Ethereum To Follow Similar Trend As Bitcoin
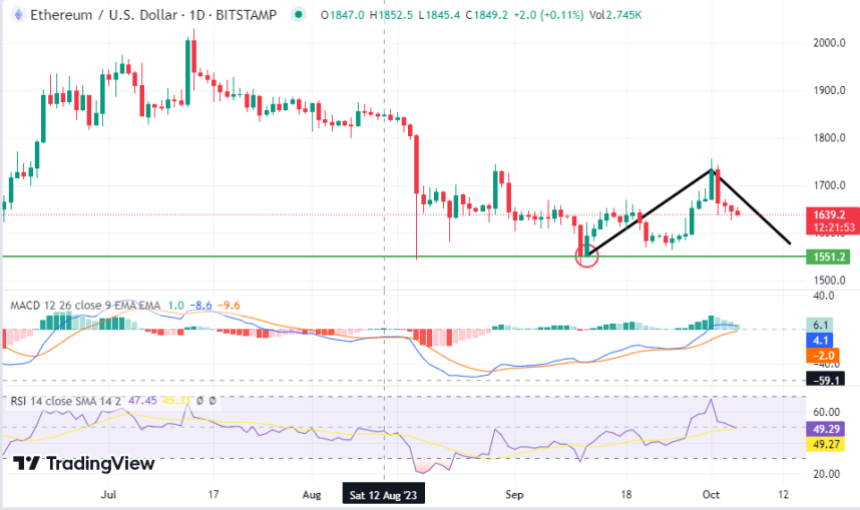
Also, ETH displays a similar price trend to Bitcoin, with a prominent dip likely to occur in the coming weeks. ETH is in a downtrend on the daily chart, forming lower lows as sellers continue to dominate the market.

Based on its historical data, it formed a bottom on September 11, after a similar decline before rallying on September 12. Therefore, ETH will likely return to the $1551 support level to form a double-bottom pattern before another rally.
Also, its Moving Average Convergence/Divergence (MACD) shows a weak buy signal with fading bullish histogram bars. Additionally, the Relative Strength Index (RSI) indicator displays a value of 49 and will likely drop to the oversold region.
Based on ETH’s past price action, traders should expect further decline in the coming weeks before a recovery.
Featured image from Pixabay and chart from TradingView.com
