- Ethereum Open Interest has seen a slight increase recently.
- ETH has maintained the $3000 range despite poor runs.
In the past few days, Ethereum’s [ETH] price has experienced some declines, but this isn’t the only notable change in key metrics.
The Open Interest has also seen significant movements, and its next direction could significantly impact traders’ sentiment.
Ethereum Open Interest sees a slight rise
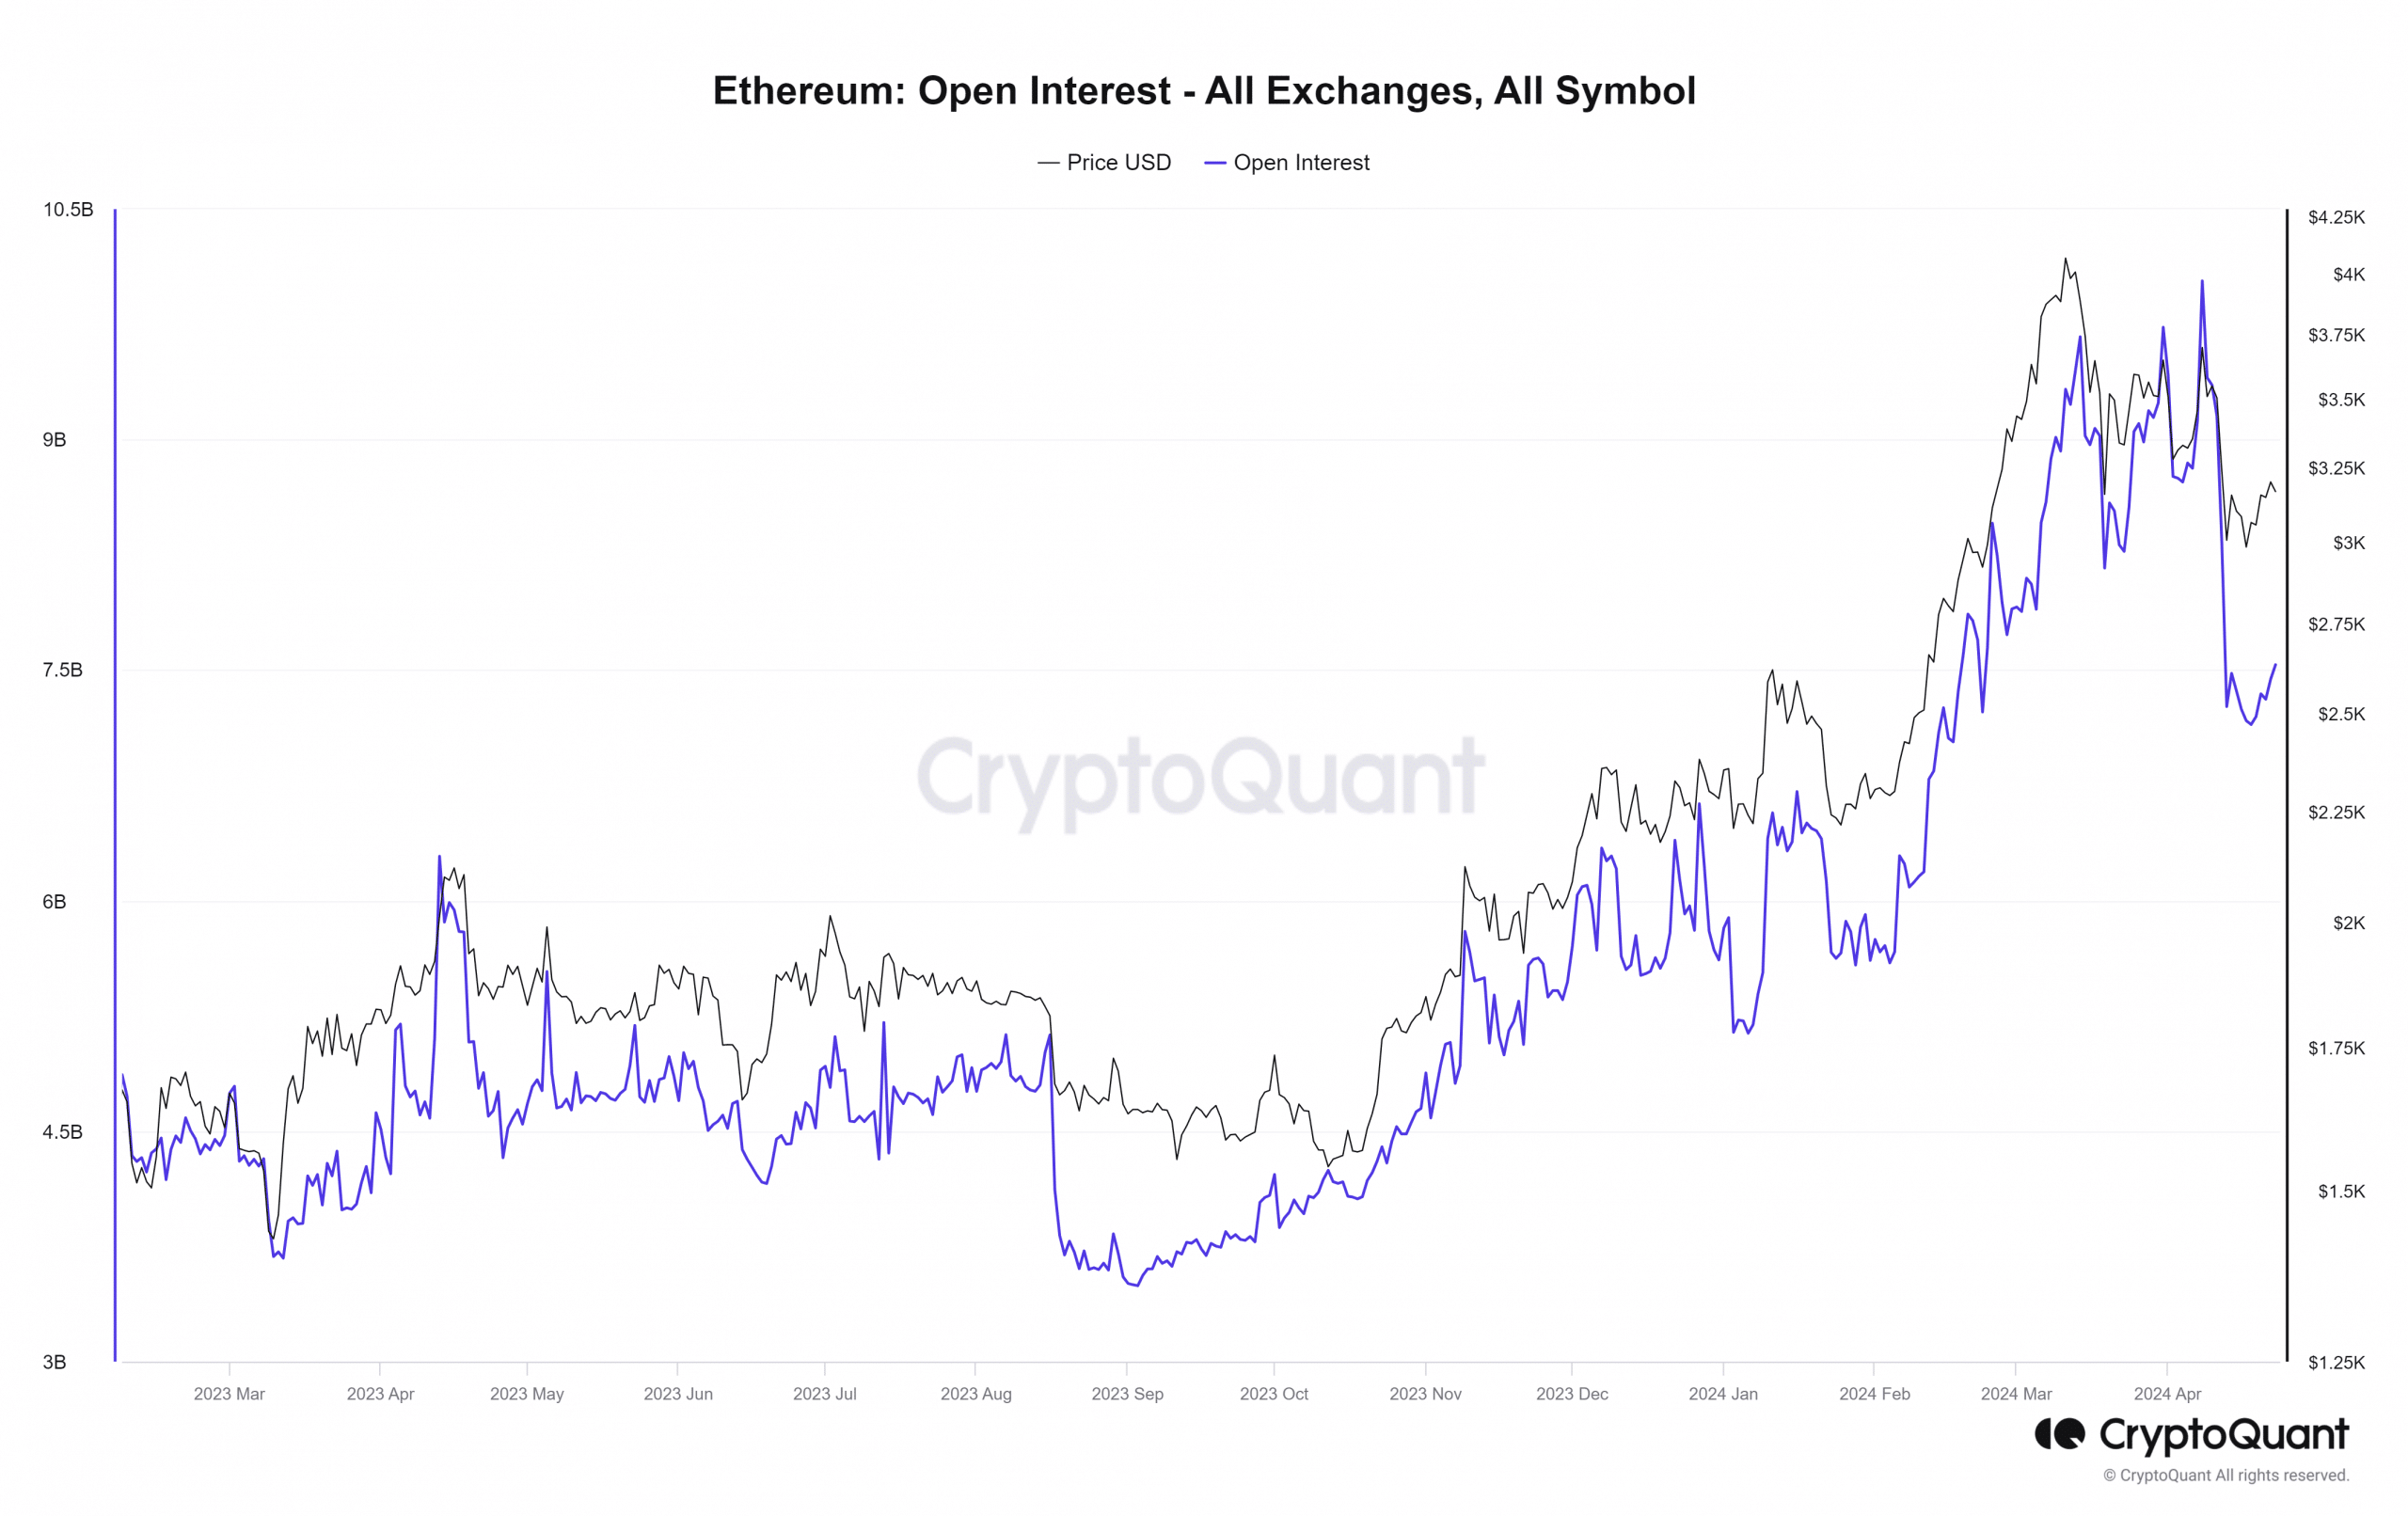
Recent data from CryptoQuant indicated significant changes in Ethereum’s Open Interest.
AMBCrypto’s analysis of the Open Interest chart revealed a notable decline starting from around the 8th of April and continuing until the 13th of April.
Before the decline, Open Interest exceeded $10 billion, falling to around $7.2 billion during the downturn.
However, there has been a recent uptick in Open Interest, reaching approximately $7.4 billion at the time of reporting. This suggested renewed inflows of funds into Ethereum.
However, the nature of these funds, whether dominated by short or long positions, remained to be determined.
The dominance of short positions would imply an expected decline in price, potentially leading to negative sentiment.
Conversely, the dominance of long positions would suggest an anticipated price rise, likely fostering positive sentiment. The direction of the Netflow could provide insight into which position might become dominant.
Long or short?
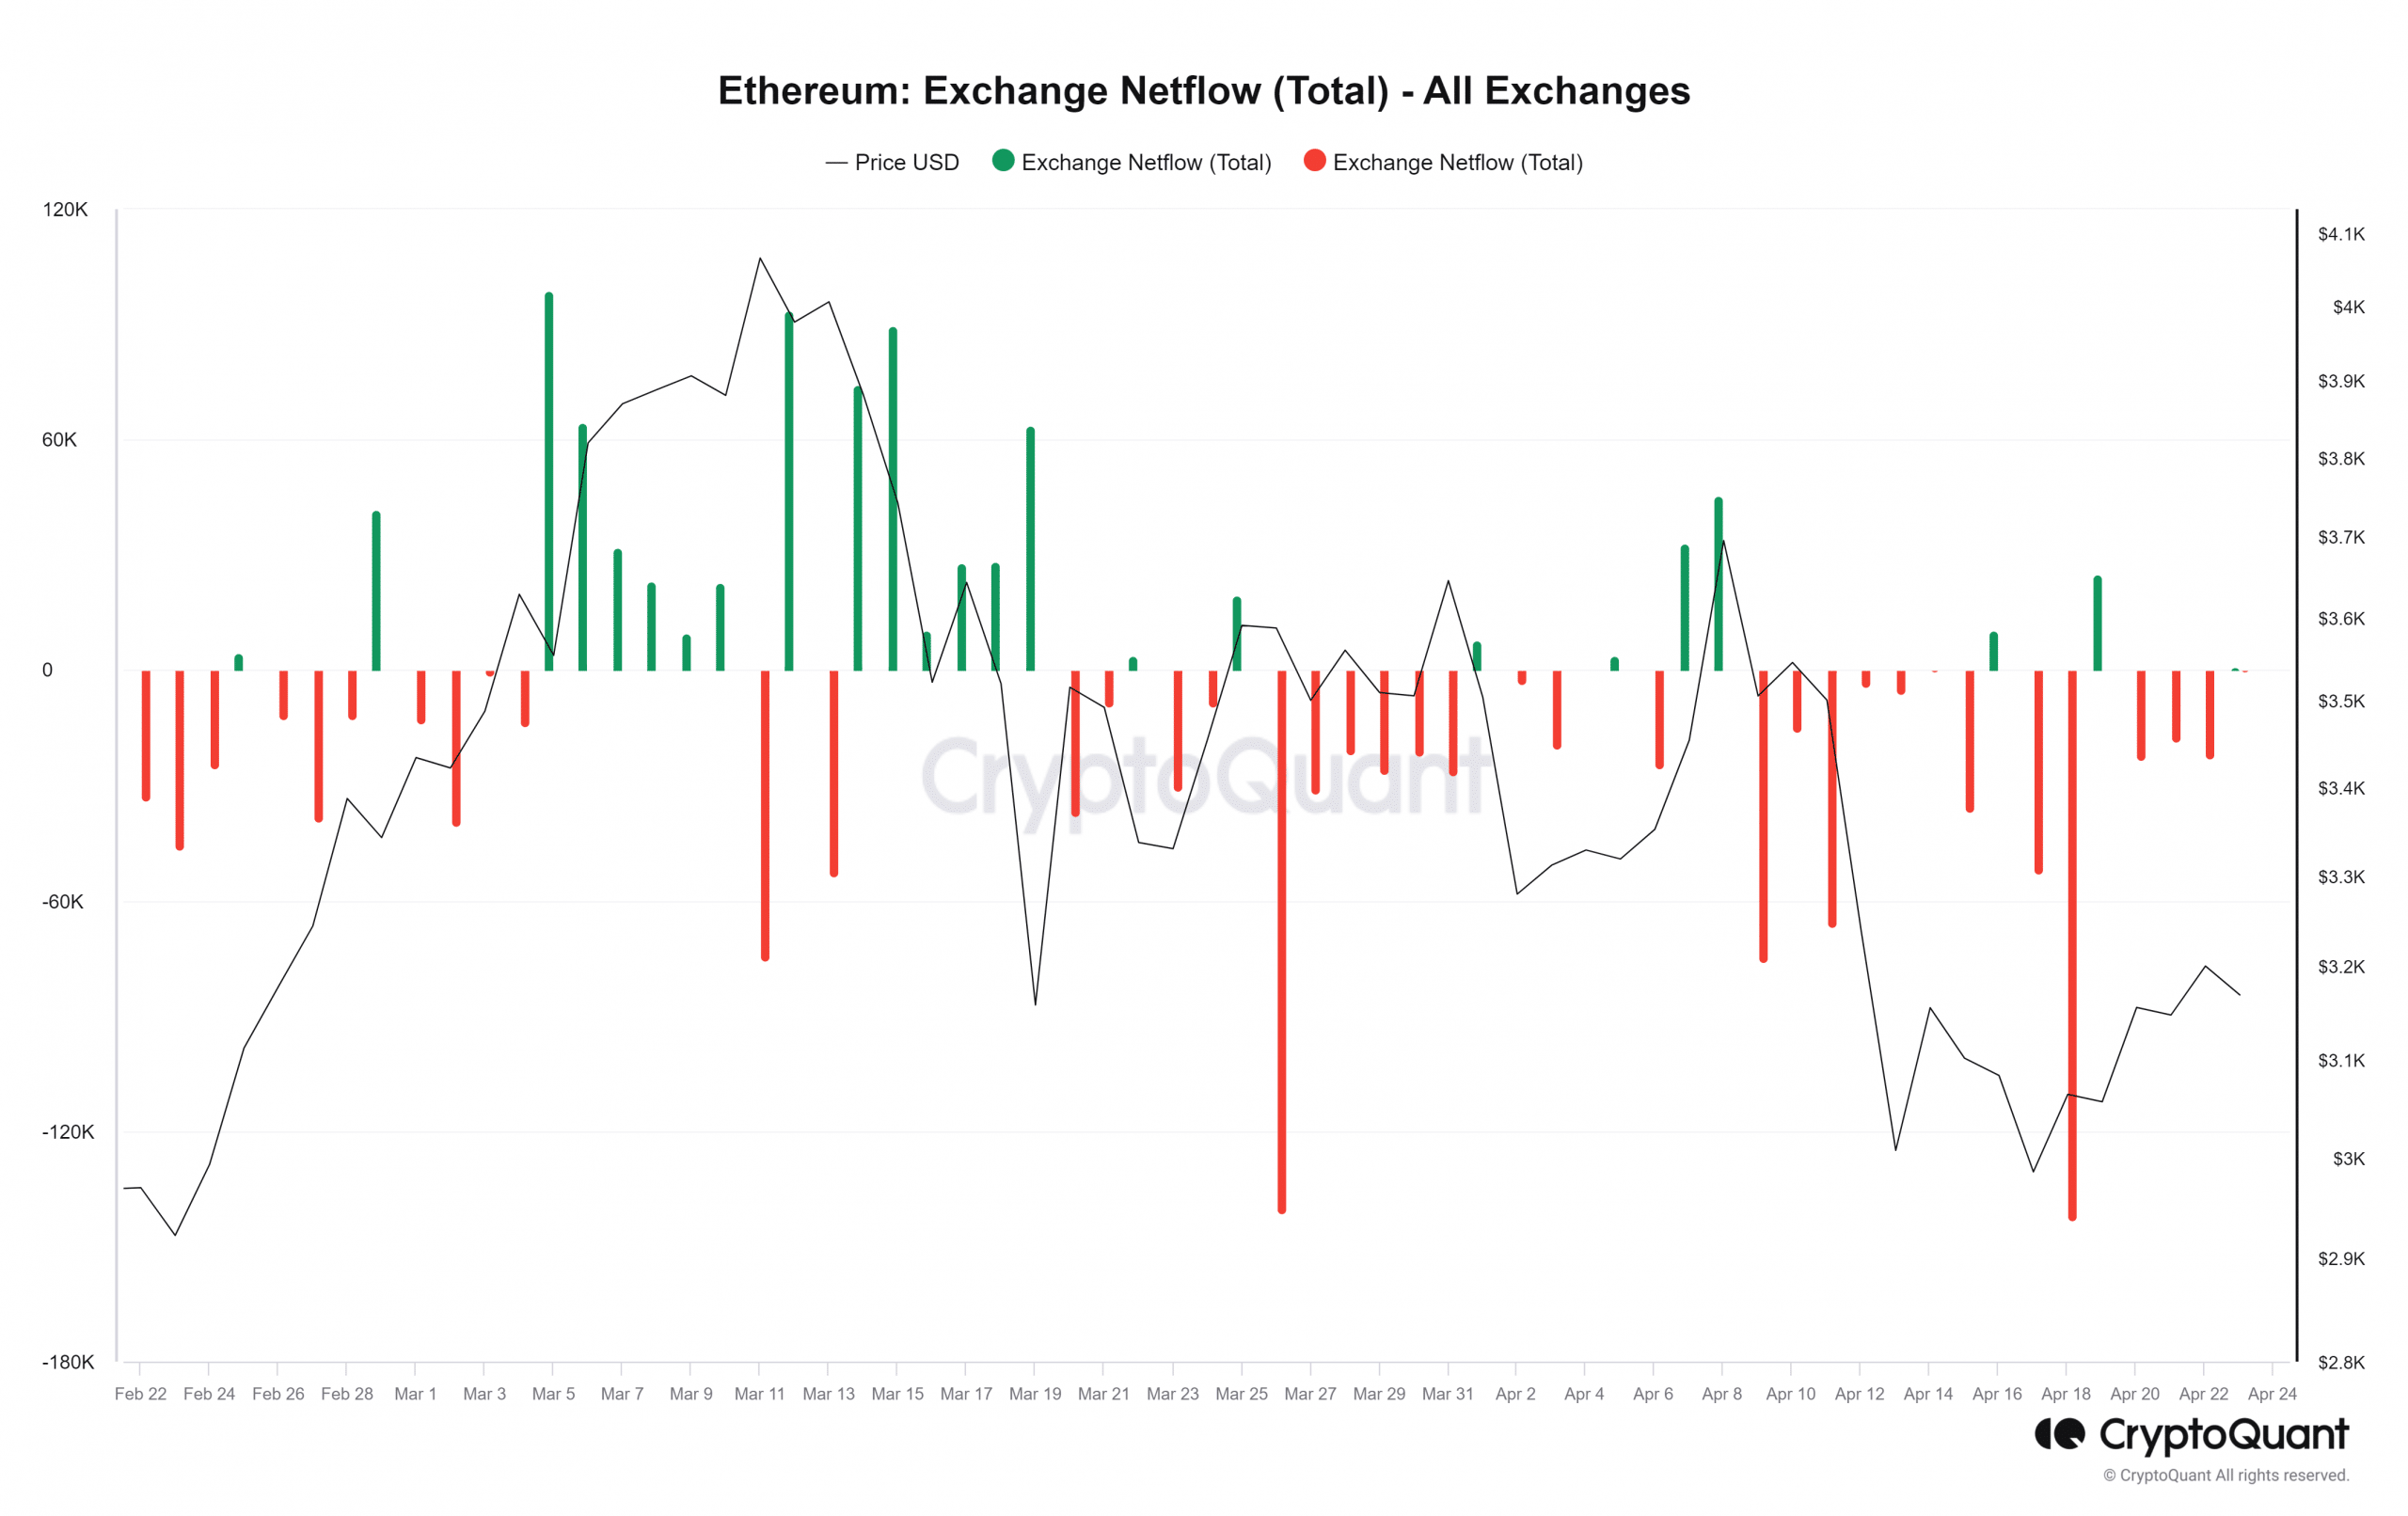
While not guaranteed due to the potential impact of other events, the direction of the Netflow can offer insights into which positions might become dominant.
AMBCrypto’s assessment of the Netflow chart showed a recent increase in Ethereum outflow. Over the last seven days, over 260,000 ETH, valued at over $781 million, have left exchanges.
In comparison, the inflow was significantly lower, confirming the dominance of outflows.
This suggested that more traders are withdrawing their ETH from exchanges, typically indicating a positive sign, as these traders seemingly anticipated a price rise.
Based on this observation, we could predict the dominance of long positions as ETH’s Open Interest increases.
Read Ethereum’s [ETH] Price Prediction 2024-25
Ethereum still stuck in bear trend
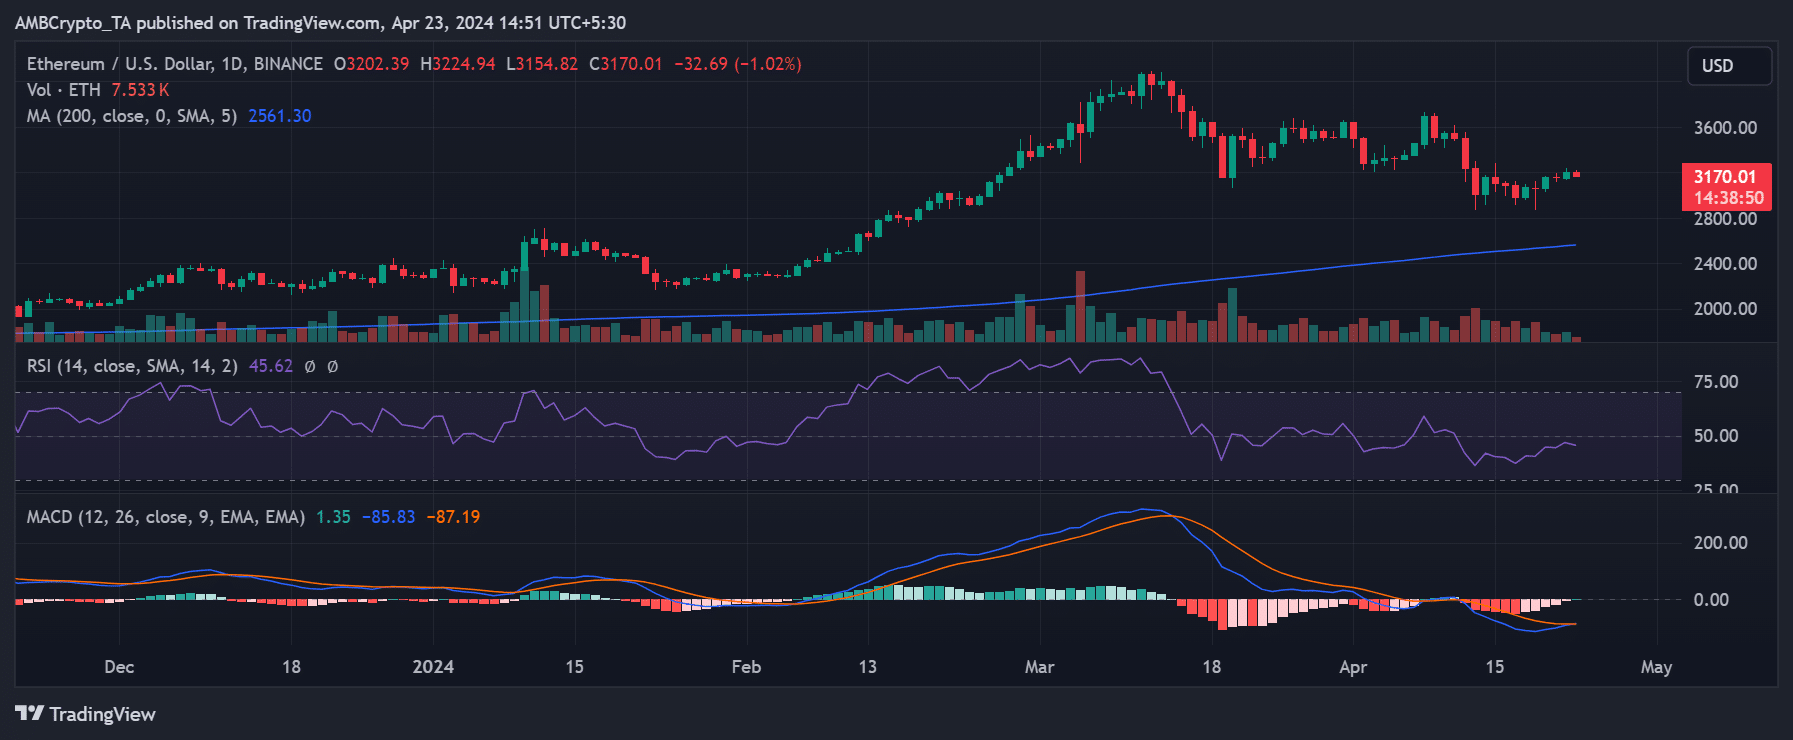
AMBCrypto’s analysis of the Ethereum price chart revealed that it has struggled to sustain consecutive uptrends of late. However, it has demonstrated more uptrend value than downtrends.
By the close of trading on the 22nd of April, Ethereum was trading at over $3,200, reflecting an increase of over 1.7%. At the time of this writing, it was trading at around $3,190, experiencing a decline of over 1%.


