- The Pi Cycle Top indicator revealed that ETH’s possible market bottom was at $3k.
- Most metrics looked bullish on ETH, but a few market indicators suggested otherwise.
After a week of nearly double-digit price drops, Ethereum [ETH] showed signs of recovery in the past 24 hours. In fact, if the latest data is to be considered, then ETH might soon showcase a massive bull rally if it manages to reclaim a particular mark.
Let’s have a closer look at what’s going on.
Bulls are buckling up
As per CoinMarketCap’s data, Ethereum’s price dropped by more than 8% in the last week. Things took a U-turn in the last 24 hours as the king of altcoins’ price surged by 1.7%.
At the time of writing, ETH was trading at $2,650 with a market capitalization of over $318 billion.
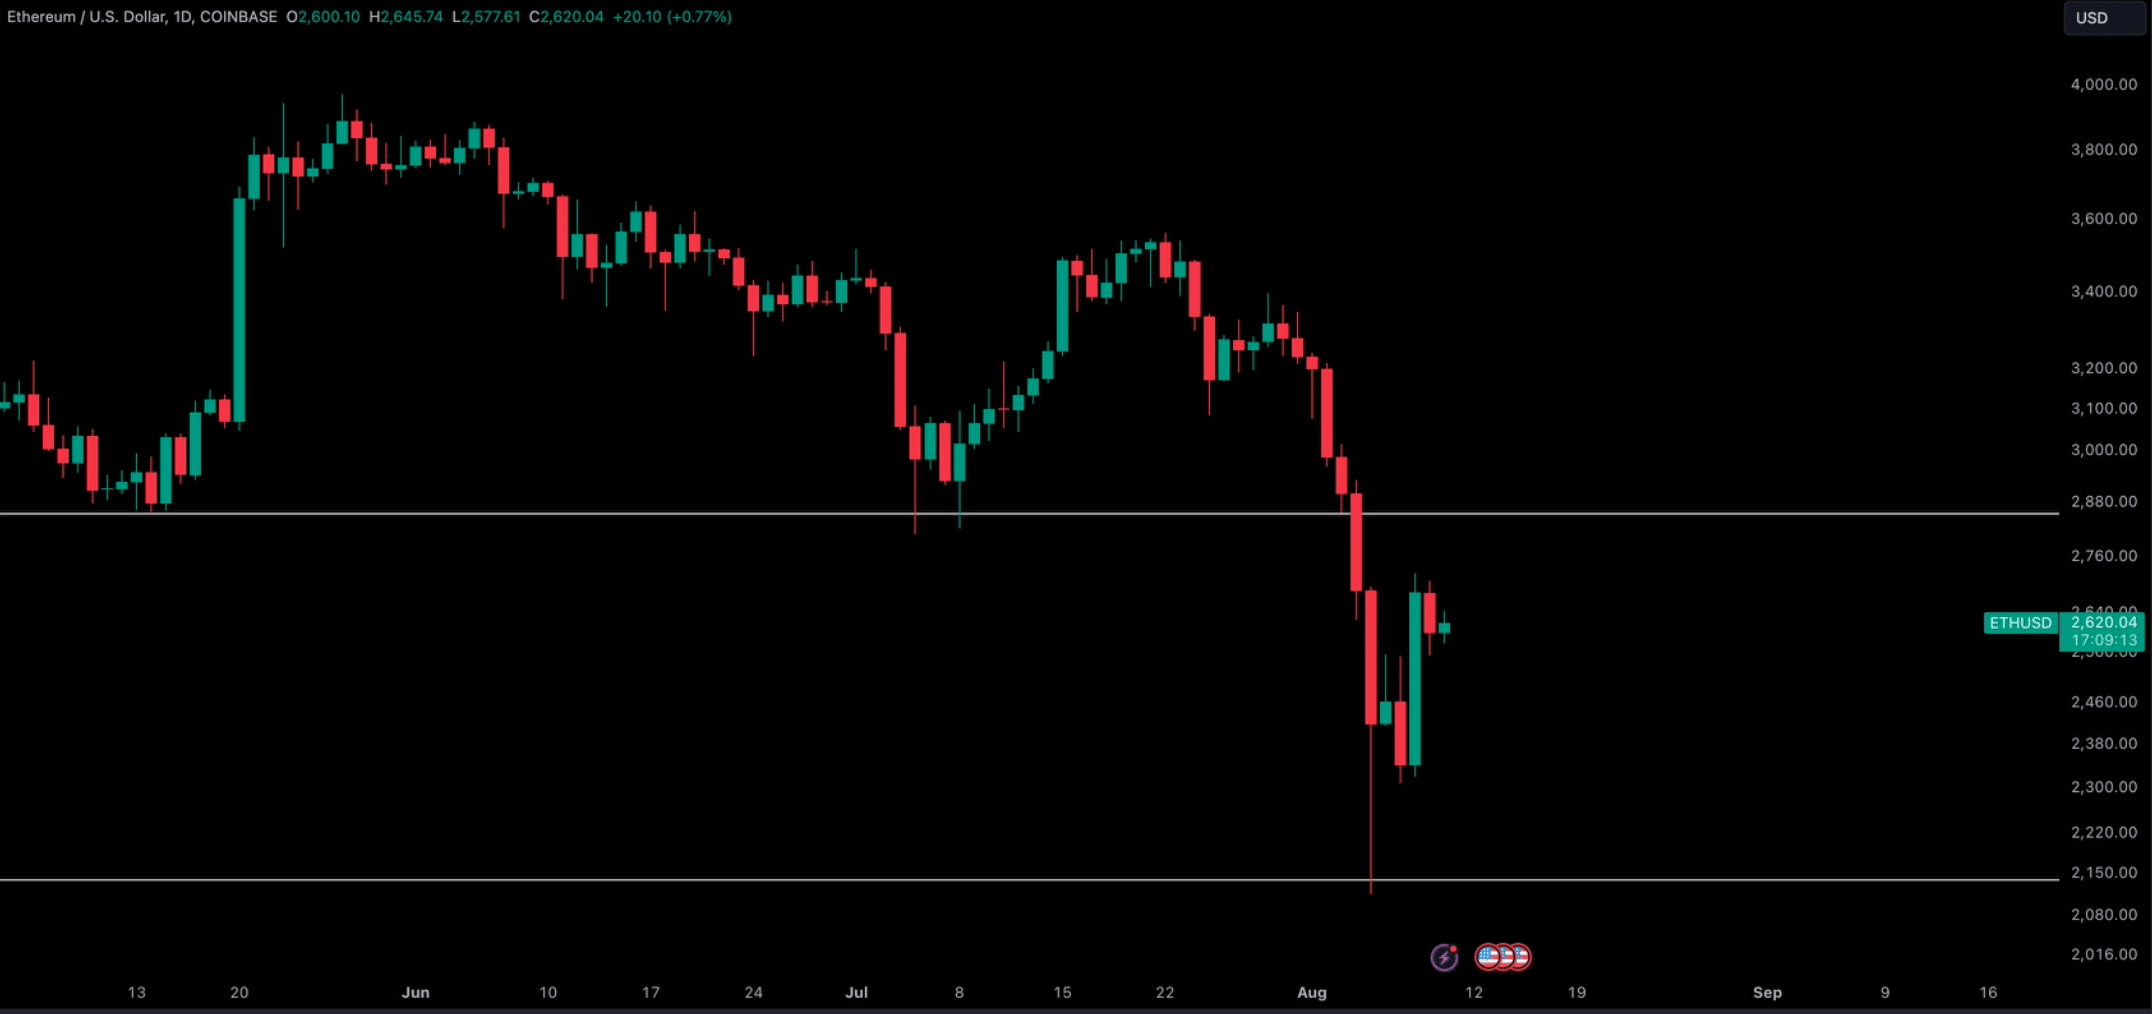
While that happened, Crypto Tony, a popular crypto analyst, recently posted a tweet highlighting an interesting update. As per the tweet, if ETH reclaims $2,850, then ETH might get back on track and might even begin a fresh bull rally.
Odds of ETH reclaiming $2,850
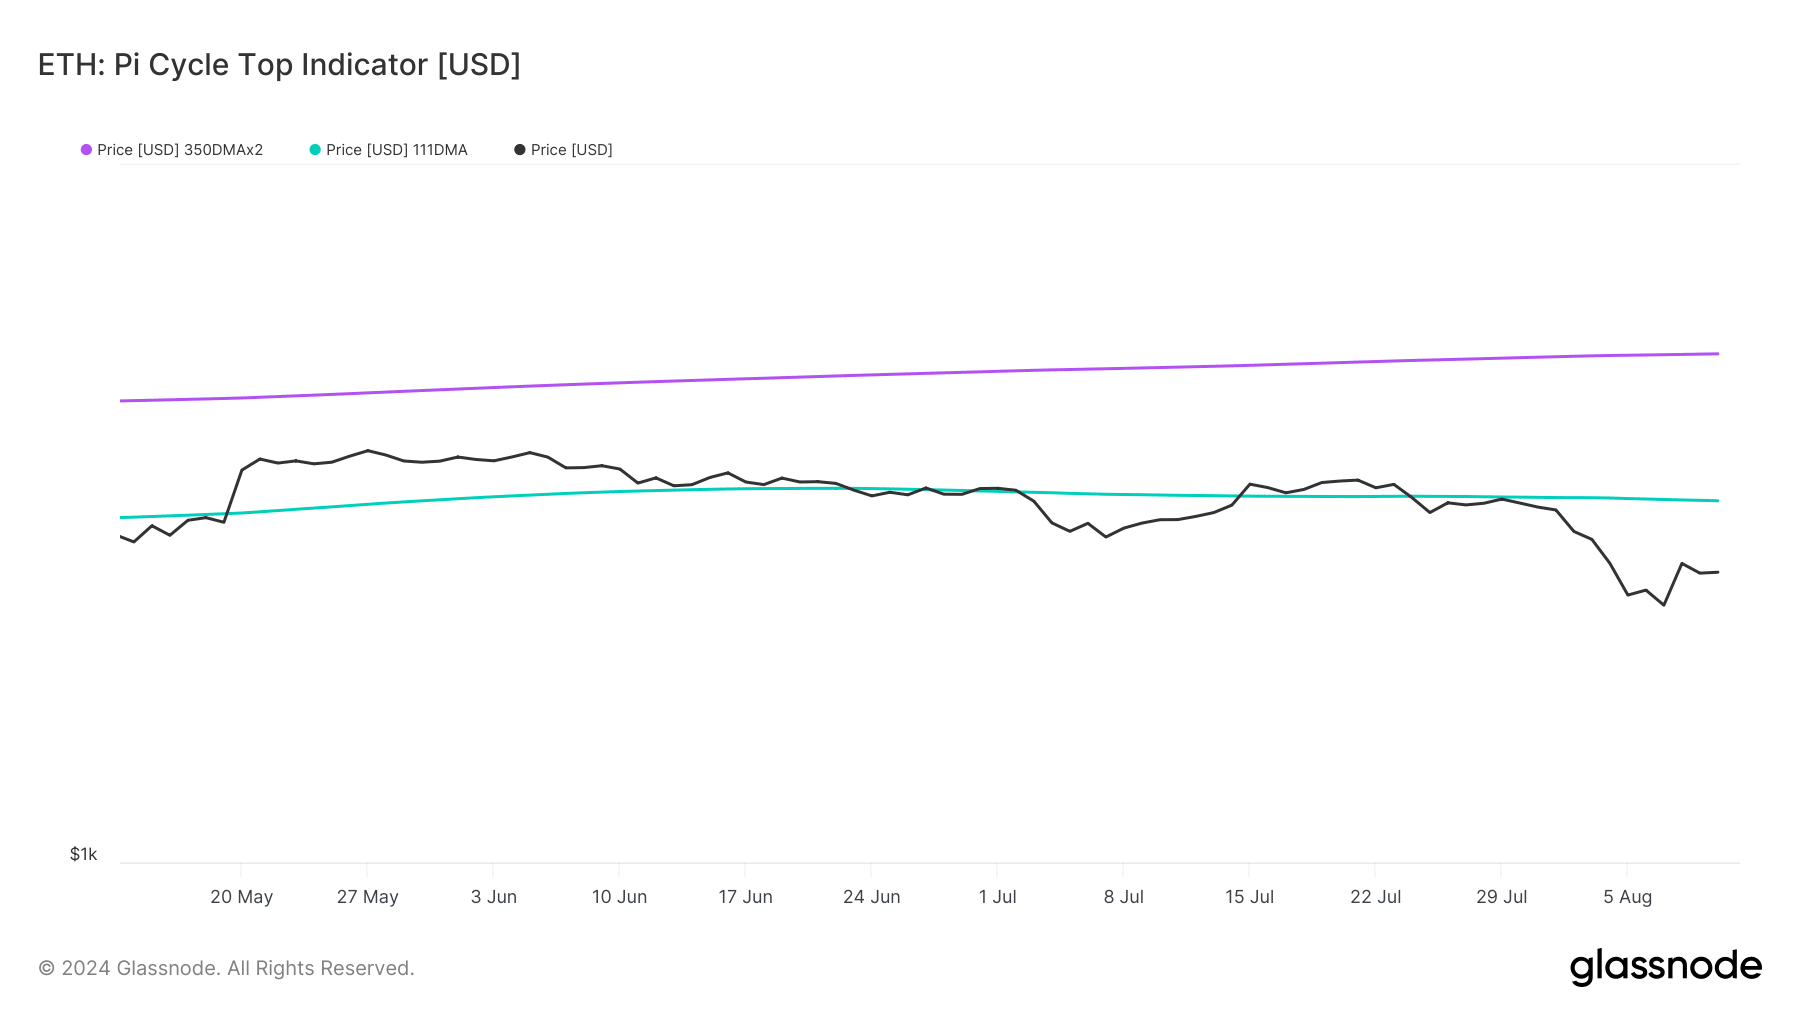
AMBCrypto analysis of Glassnode’s data revealed an interesting metric. ETH’s Pi Cycle Top indicator revealed that ETH has been trading well below its possible market bottom of $3k.
Therefore, it seemed much more likely for the king of altcoins to reclaim $2,850. If the metric is to be believed, then ETH had a market top of over $5.3k.
We then took a look at CryptoQuant’s data to better understand what to expect from the token. We found that its exchange reserve was dropping, meaning that buying pressure was strong.
Its Coinbase premium was green, indicating that buying sentiment was dominant among US investors. Its transfer volume also increased in the last 24 hours, which was bullish.
Apart from these, things in the derivatives market also looked pretty optimistic. For example, ETH’s taker buy/sell ratio revealed that buying sentiment was dominant in the derivatives market.
More buy orders were filled by takers. Moreover, another bullish metric was the funding rate, which was increasing.
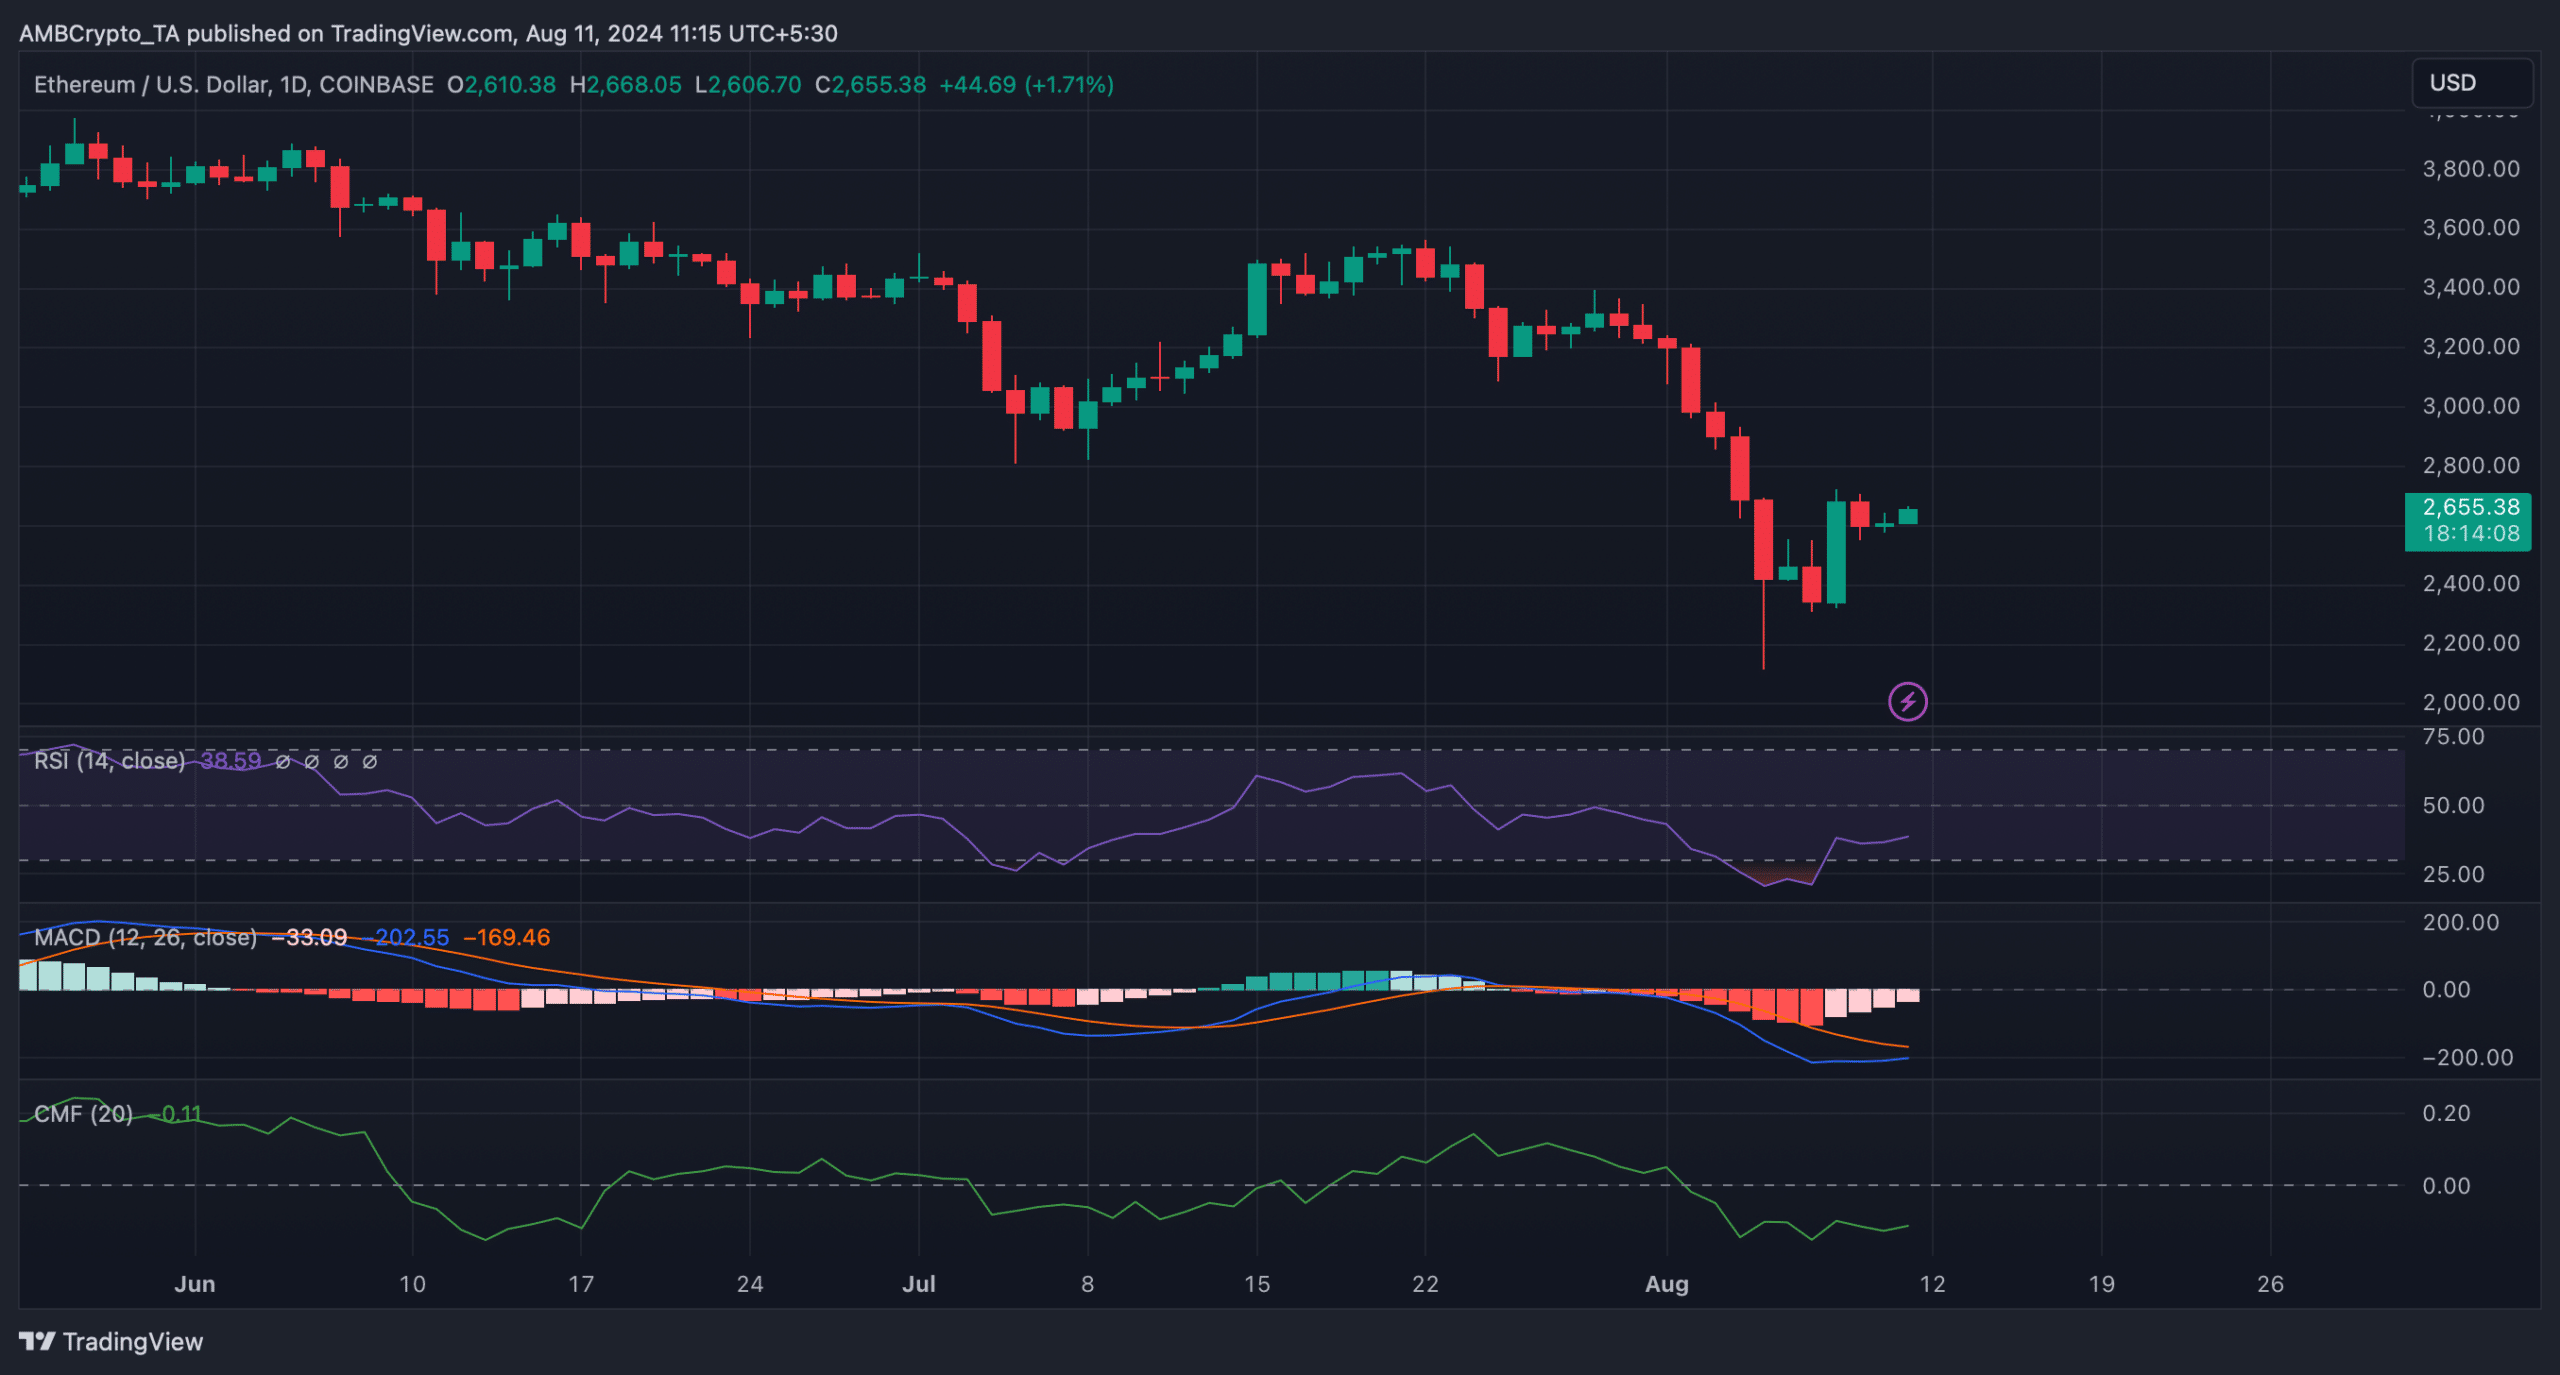
The technical indicator MACD also displayed the possibility of a bullish crossover, further suggesting a continued price increase.
Read Ethereum (ETH) Price Prediction 2024-25
However, the Relative Strength Index (RSI) moved sideways.
The Chaikin Money Flow (CMF) had a value of -0.11, meaning that it was well under the neutral mark. Both the RSI and CMF indicated that investors might witness a few slow-moving days ahead.


