ETH price is struggling to gain pace above the $152 and $158 resistance levels against the US Dollar.The price is currently holding the main $144 support area and breakdown zone.There is a key contracting triangle forming with resistance near $150 on the 4-hours chart of ETH/USD (data feed via Kraken).The pair could start a strong upward move once it surpasses $152 and $158.Ethereum price is trading above a few important supports against the US Dollar, similar to bitcoin. ETH price needs to settle above $158 for an uptrend reversal.Ethereum Price Weekly AnalysisAt the end of the last month, Ethereum tested the $158 resistance area against the US Dollar, where it faced a lot of hurdles. A high was formed near $158 and the price started a downside correction.It broke the $152 support and remained well below the 100 simple moving average (4-hours). Moreover, there was a break below the 23.6% Fib retracement level of the upward move from the $132 swing low to $158 high.However, the $144 and $145 levels are acting as strong buy zones. Besides, the 50% Fib retracement level of the upward move from the $132 swing low to $158 high is acting as a support.At the outset, there is a key contracting triangle forming with resistance near $150 on the 4-hours chart of ETH/USD. The triangle support is near the $144 area.Therefore, a successful break below the $144 support might start another bearish wave below the $140 level. The next major support is near the $132 swing low. Any further losses could lead Ethereum price towards the $125 zone.On the upside, there are many resistances, starting with the triangle resistance near $150. If there is an upside break above $150 and $152, the price could revisit the $158 resistance area.To start a fresh increase and uptrend, the price must settle above the $158 resistance and the 100 simple moving average (4-hours). In the mentioned bullish case, the price is likely to rally above the $160 and $165 levels. The next major resistance is near the $172 level.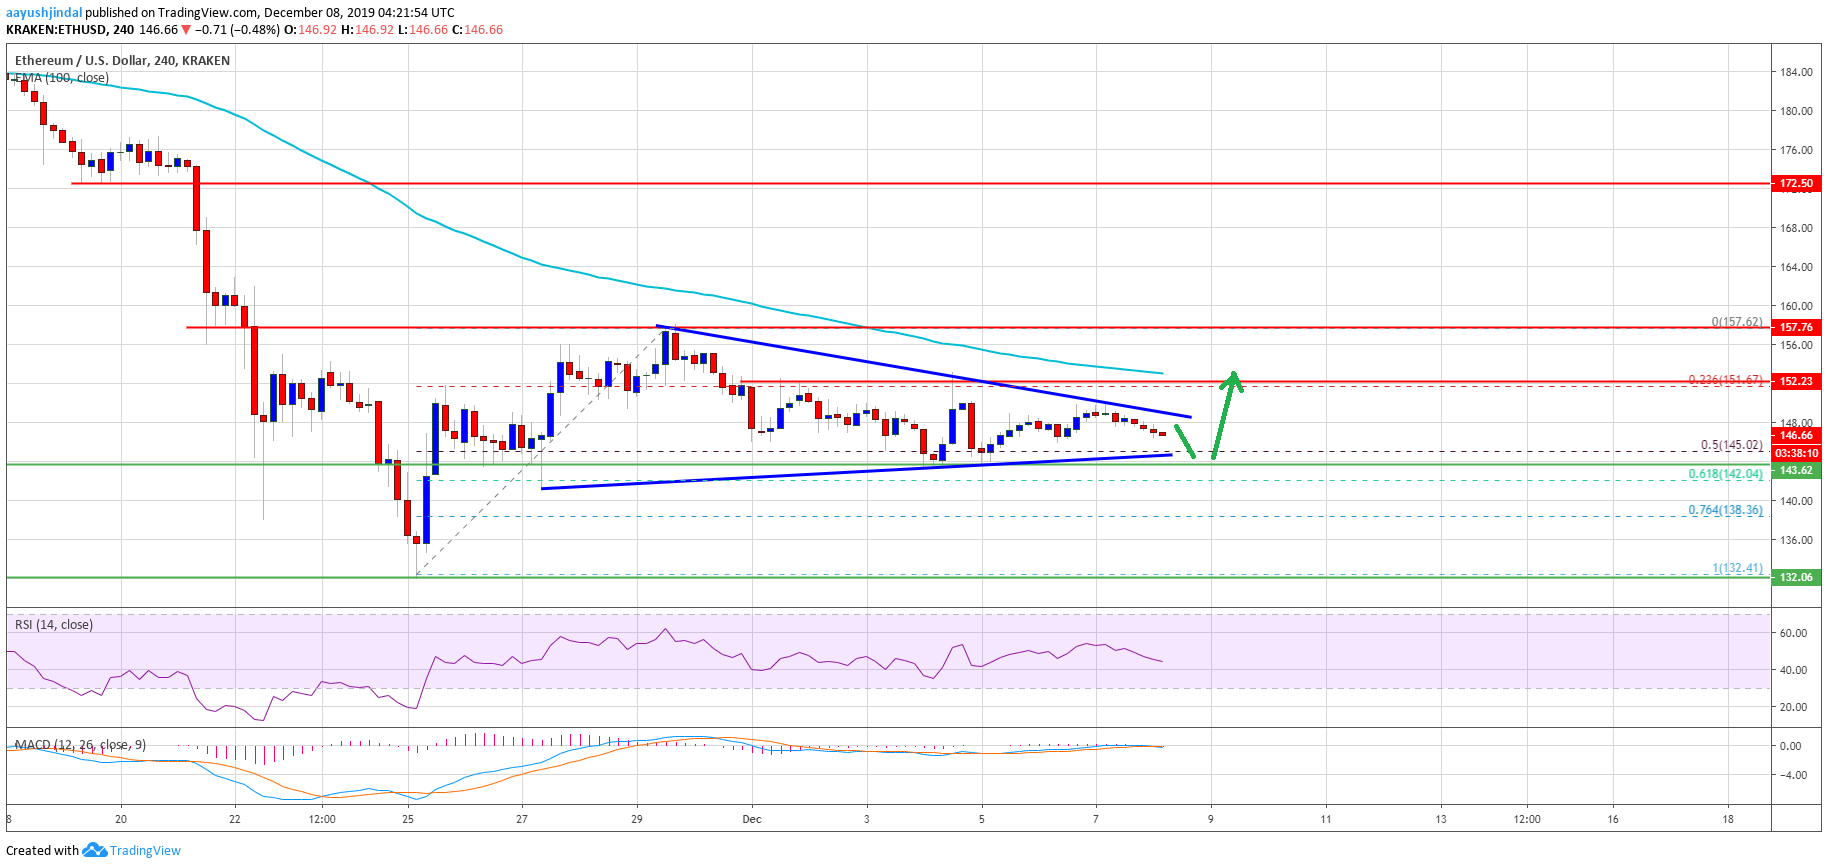 Ethereum PriceThe above chart indicates that Ethereum price is trading above an important support near $144. As long as there is no bearish break below the $144 support, there are high chances of a strong rally above the $152 and $158 resistance levels.Technical Indicators4 hours MACD – The MACD for ETH/USD is currently losing strength in the bullish zone.4 hours RSI – The RSI for ETH/USD is currently declining and it is below the 50 level.Major Support Level – $144Major Resistance Level – $158
Ethereum Watch
ETHEREUM and ICO TOKENS
