Ethereum has faced a strong correction over the past few days that easily overshadows Bitcoin’s move. From the local highs near $490 to the local lows, the cryptocurrency fell by over 35%, shocking most investors as they were bullish just days before.
ETH has already bounced since falling as low as $315, undergoing a rapid 14% rally to $360 on Sunday morning.
While key supports in the low-$300s were held due to this bounce, more technical signals suggest that Ethereum has room to slide.
Related Reading: Here’s Why This Crypto CEO Thinks BTC Soon Hits $15,000
Ethereum Has Room to Drop
Ethereum is prepared to move lower after already correcting by over 35% in the span of four days.
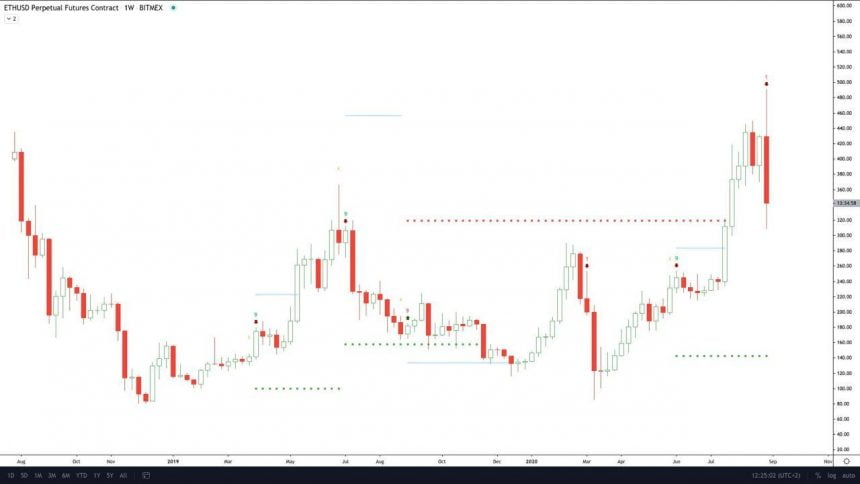
A Telegram channel tracking the Tom Demark Sequential reported on Sunday that the leading cryptocurrency has formed a bearish signal on its weekly chart. The signal is a Tom Demark Sequential “Quasi Sell 9” candle, which is a candle type often seen when an asset has reached a bearish inflection point in its trend.


Chart of ETH's price action over the past year with a Tom Demark Sequential analysis by a Telegram group tracking the indicator. Chart from TradingView.com
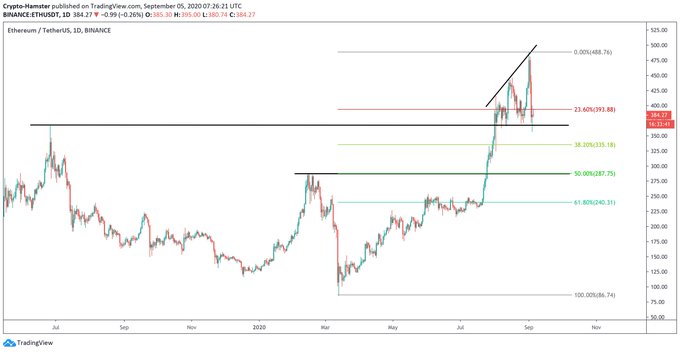
Prior to the ongoing correction, one trader said that simple technical analysis indicates Ethereum was primed to fall to $290 after losing the support around $370:
“#Ethereum has formed a broadening formation that normally has no preferred direction of a breakout. The bottom of the formation matches a long-term S/R level. If it is broken, the next potential target is at ~290$ – the second support and a 50% Fibonacci retracement.”
Chart of ETH's price action over the past year with analysis by crypto trader and chartist "CryptoHamster" (@CryptoHamsterIO on Twitter). Chart from TradingView.com
Other analysts have noted that there is little historical support until $290, which sits 18% below the current market price of Ethereum.
Related Reading: These 3 Trends Suggest BTC Is Poised to Bounce After $1,000 Drop
Other Altcoins Printed the Same Signal
Altcoins aside from Ethereum printed the exact same Tom Demark Sequential signal as the one aforementioned.
According to the Telegram channel that first spotted this signal, the same signal has appeared on the charts of Band Protocol (BAND), Cosmos’s ATOM, and many other coins.
Related Reading: There’s an “Unusual” Amount of BTC Sellling Pressure From Miners
Featured Image from Shutterstock
Price tags: ethusd, ethbtc
Charts from TradingView.com
This Textbook Signal Predicts Ethereum Has Room to Drop After 35% Correction

