- Ethereum has finally caught a breather in the last 48 hours.
- The price held steady above the $3,000 price range.
Ethereum [ETH] maintained a stable trading range in the $3,500 zone until it encountered significant declines that substantially reduced its price.
Despite this downturn, the flow of Ethereum across exchanges has been mixed, reflecting varied sentiments among traders.
Ethereum recovers from declines
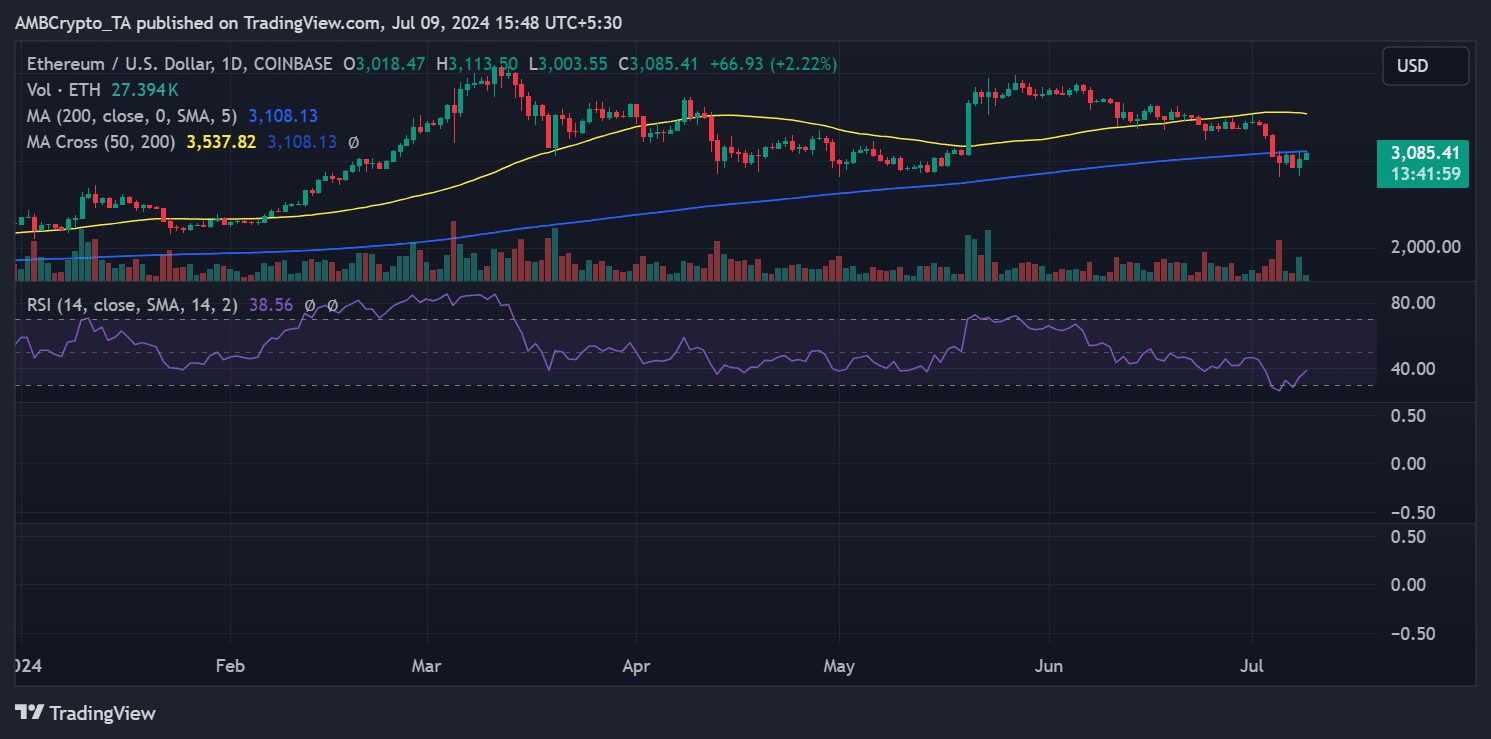
AMBCrypto’s analysis of Ethereum on a daily time frame revealed a volatile start to the month. On the 1st of July, ETH was trading at approximately $3,430.
The following day, it experienced a slight decline but stayed within the $3,400 range.
However, the subsequent days brought more pronounced decreases, and by 5th July, Ethereum’s price had dropped to around $2,980.
ETH experienced more fluctuations after that, oscillating between gains and losses. By the 8th of July, there was a noticeable recovery with a nearly 3% increase, bringing its price to about $3,018.
As of this writing, it was trading with an increase of over 2% at approximately $3,083.

Source: TradingView
Additionally, the Relative Strength Index (RSI) also showed a slight increase in tandem with the price.
Despite this improvement, the RSI sat below the neutral 50 mark at press time, specifically around 40, indicating that while the market sentiment is recovering, it still remained bearish territory.
Ethereum’s stable sentiments
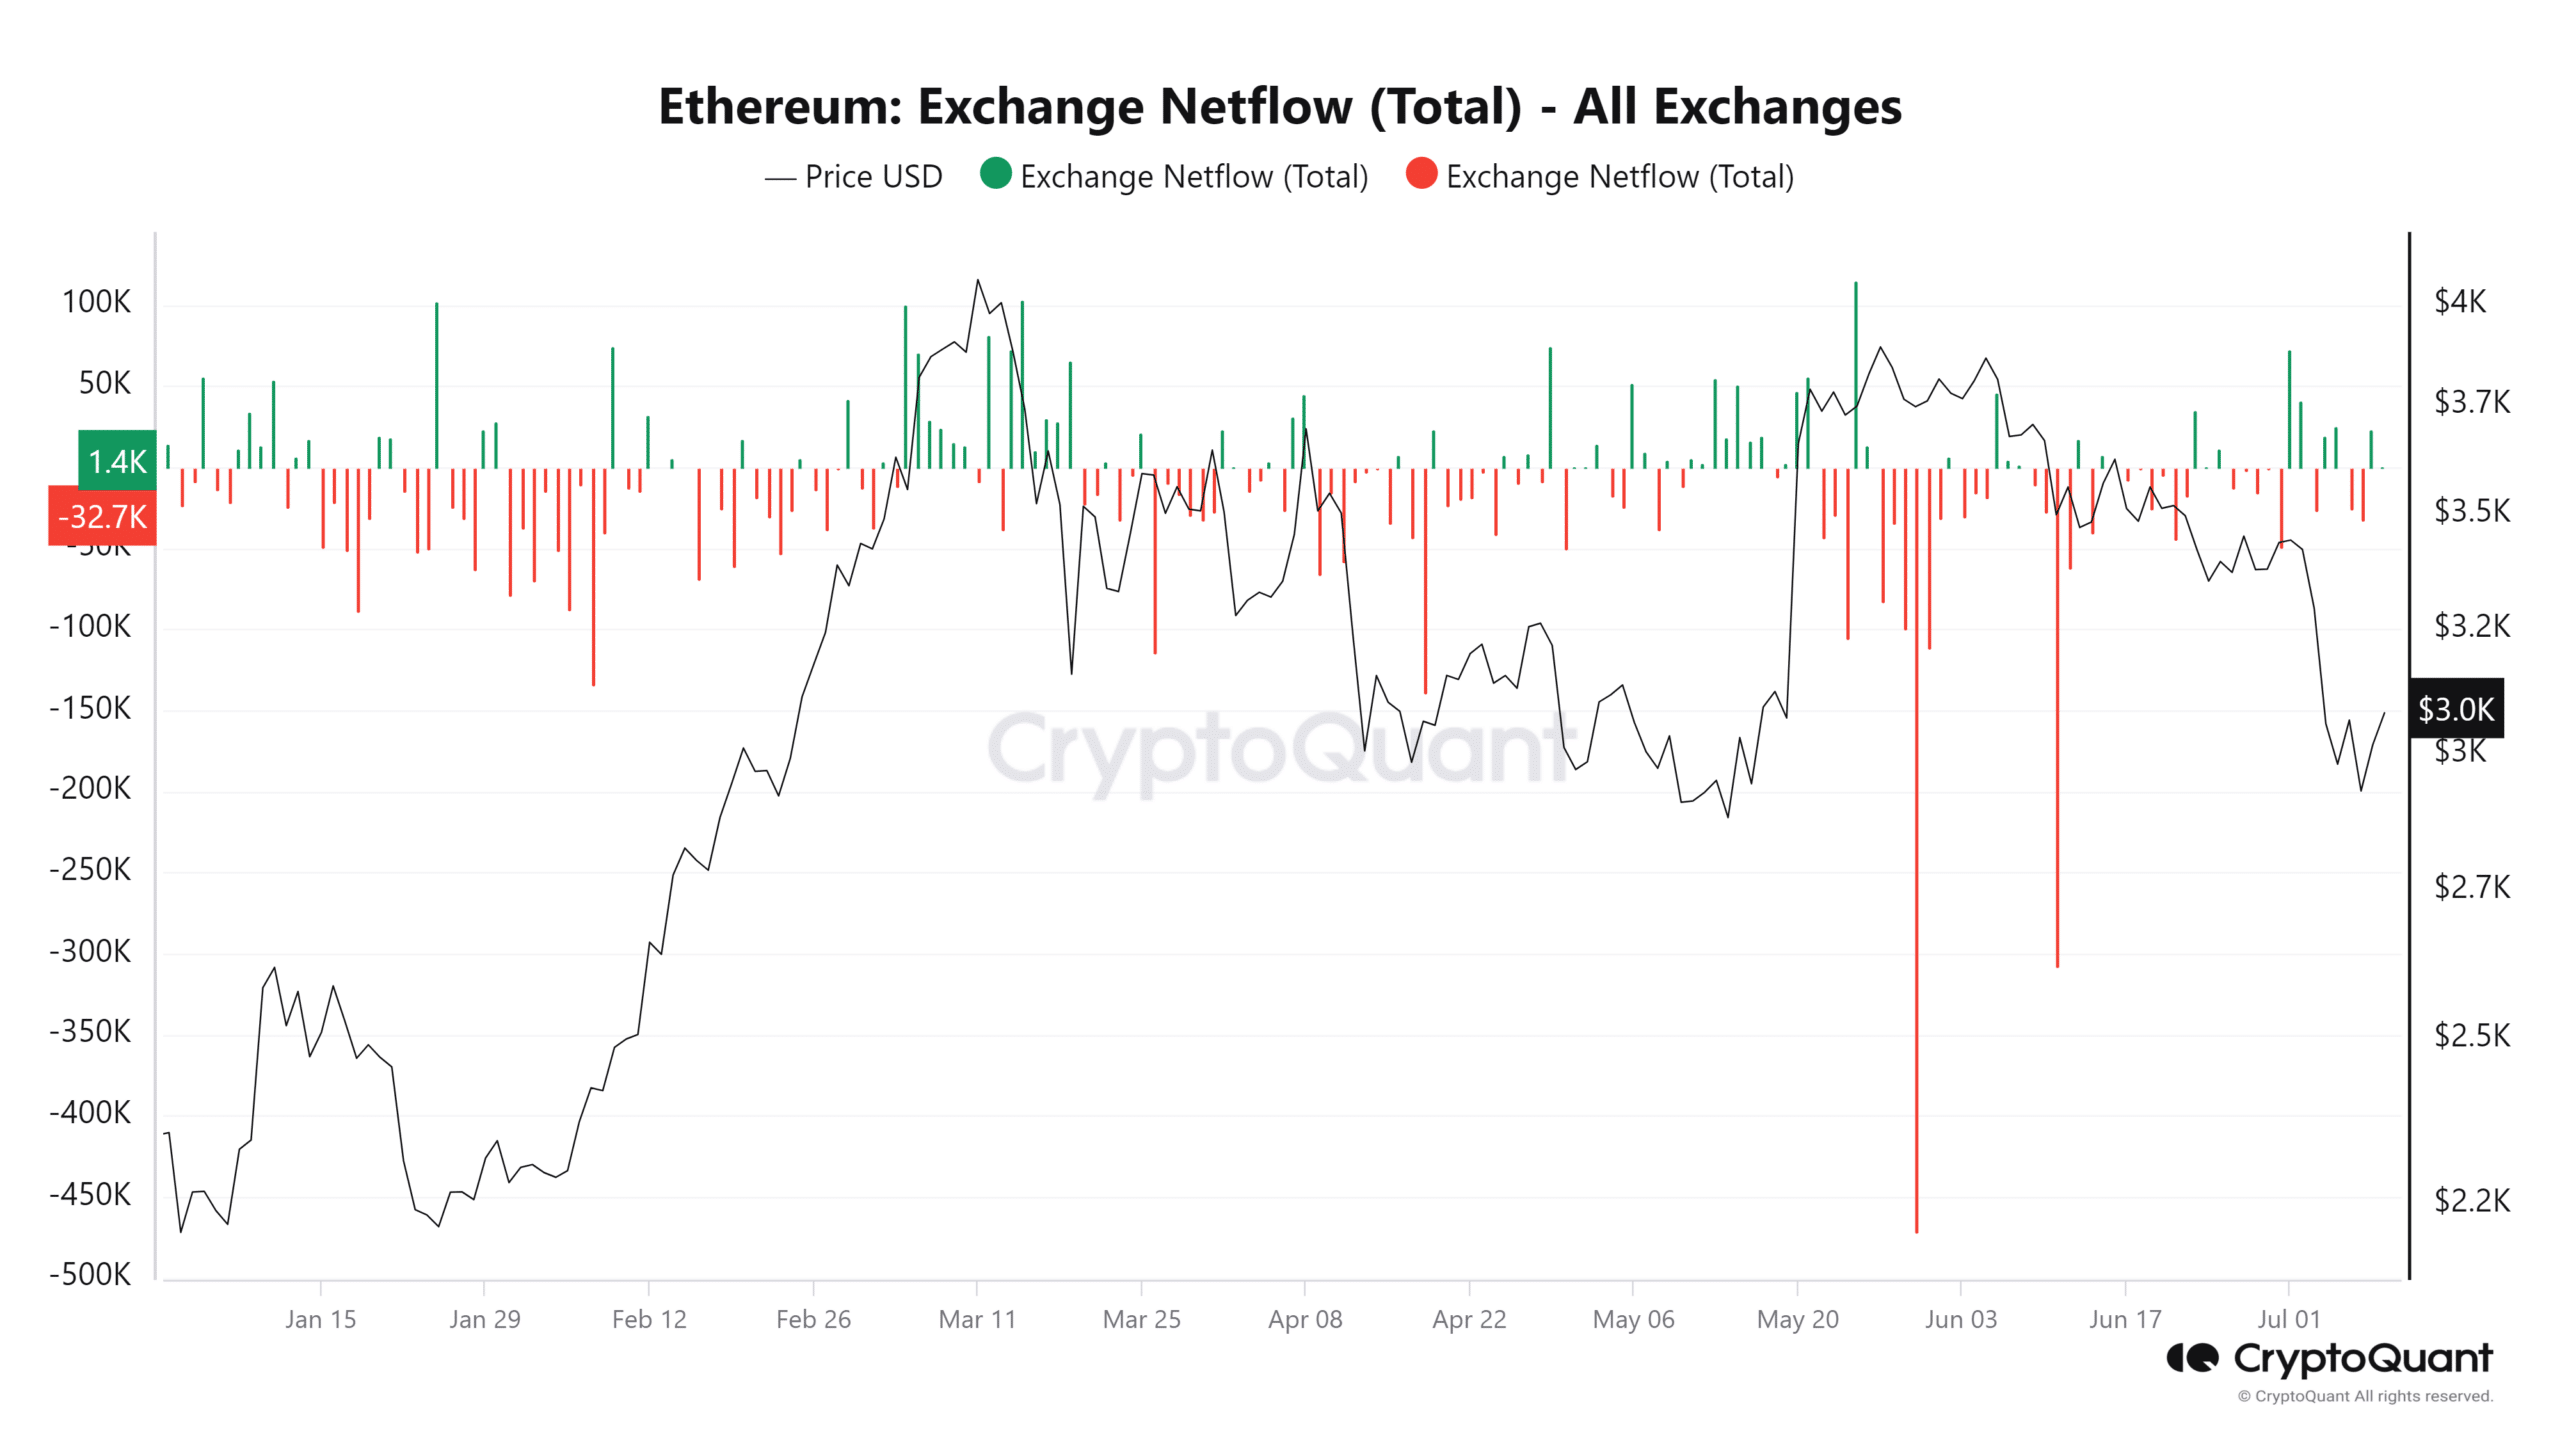
The analysis of Ethereum’s exchange netflow from CryptoQuant revealed a fluctuating pattern between inflows and outflows, indicative of mixed trader sentiment.
Over the past two days, the netflow has been positive, meaning that more Ethereum has been deposited into exchanges than withdrawn. This suggests that traders are likely preparing to sell or trade, anticipating either taking profits or mitigating losses.
Conversely, in the days leading up to this, the netflow was negative, indicating that withdrawals of Ethereum from exchanges were more prevalent than deposits.
This trend is typically associated with traders moving their holdings to private wallets for long-term holding or reducing exposure to exchange-related risks.
The fact that there hasn’t been a significant skew towards either heavy inflows or outflows suggests that traders’ sentiment has remained relatively unchanged, and normal market dynamics continue.
Volume confirms buyers’ dominance
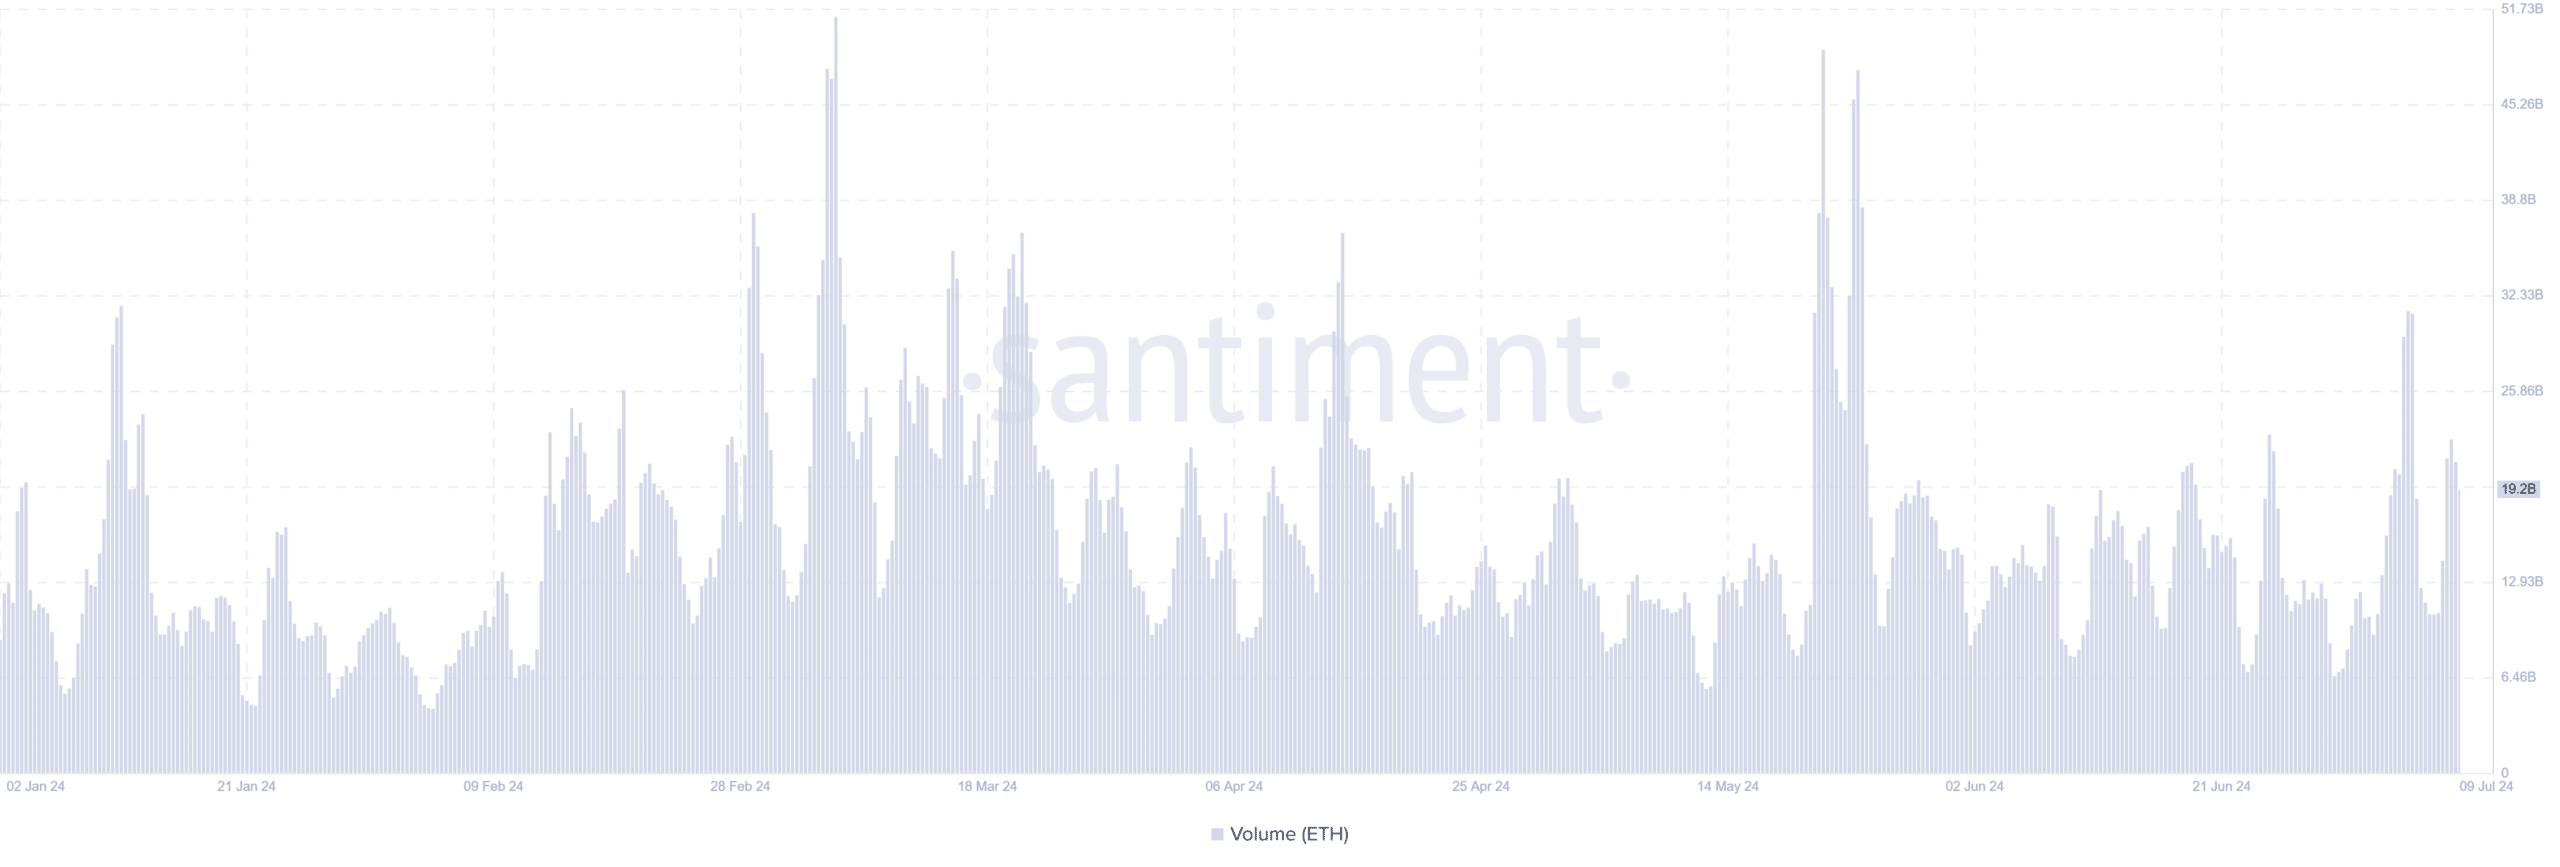
The analysis of Ethereum’s trading volume over the past 48 hours indicates a noticeable increase, suggesting a revival in market activity.
According to data from Santiment, there was a brief dip in trading volume to around $10 billion on the 7th of July.
Realistic or not, here’s ETH market cap in BTC’s terms
However, this decline was short-lived, and by the 8th of July, the trading volume had surged to over $21 billion. As of this writing, the volume remained high at over $19 billion.
This increase in trading volume, particularly with the current price trend, implies that buying activity has been more dominant than selling.


