Ethereum is slowly moving lower towards the $125 support area against the US Dollar.The price is likely to extend losses as long as it is below the $132 resistance.There is a key declining channel forming with resistance near $131 on the hourly chart of ETH/USD (data feed via Kraken).ETH could decline in the near term before it starts a strong rally towards $150 and $175.Ethereum price is correcting lower versus the US Dollar, while bitcoin is consolidating. ETH price must stay above $120 this week to start a fresh increase.Ethereum Price AnalysisAfter forming a top near the $138 level, Ethereum price started a downside correction against the US Dollar. ETH price broke the $135 and $132 support levels to enter a short term bearish zone.Moreover, there was a close below $132 and the 100 hourly simple moving average. Recently, there was a break below the $130 support and the price traded close to the $128 support.A low is formed near $128 and the price is currently recovering. It is trading near the $130 level and the 100 hourly simple moving average. Besides, it is testing the 23.6% Fib retracement level of the downward move from the $138 high to $128 low.On the upside, there are two key hurdles forming near $131 and $132. Additionally, there is a key declining channel forming with resistance near $131 on the hourly chart of ETH/USD.The main hurdle for a trend change is near the $132 resistance. It is close to the 50% Fib retracement level of the downward move from the $138 high to $128 low.Therefore, clear break above the $132 resistance might start a decent upward move towards the $135 and $138 levels. If the bulls gain momentum, Ethereum might rise steady towards the $150 resistance area.On the other hand, there are chances of more downsides below the $128 support area. The next major support is near the $125 level, below which there is a risk of a sharp decline towards $120 or $115.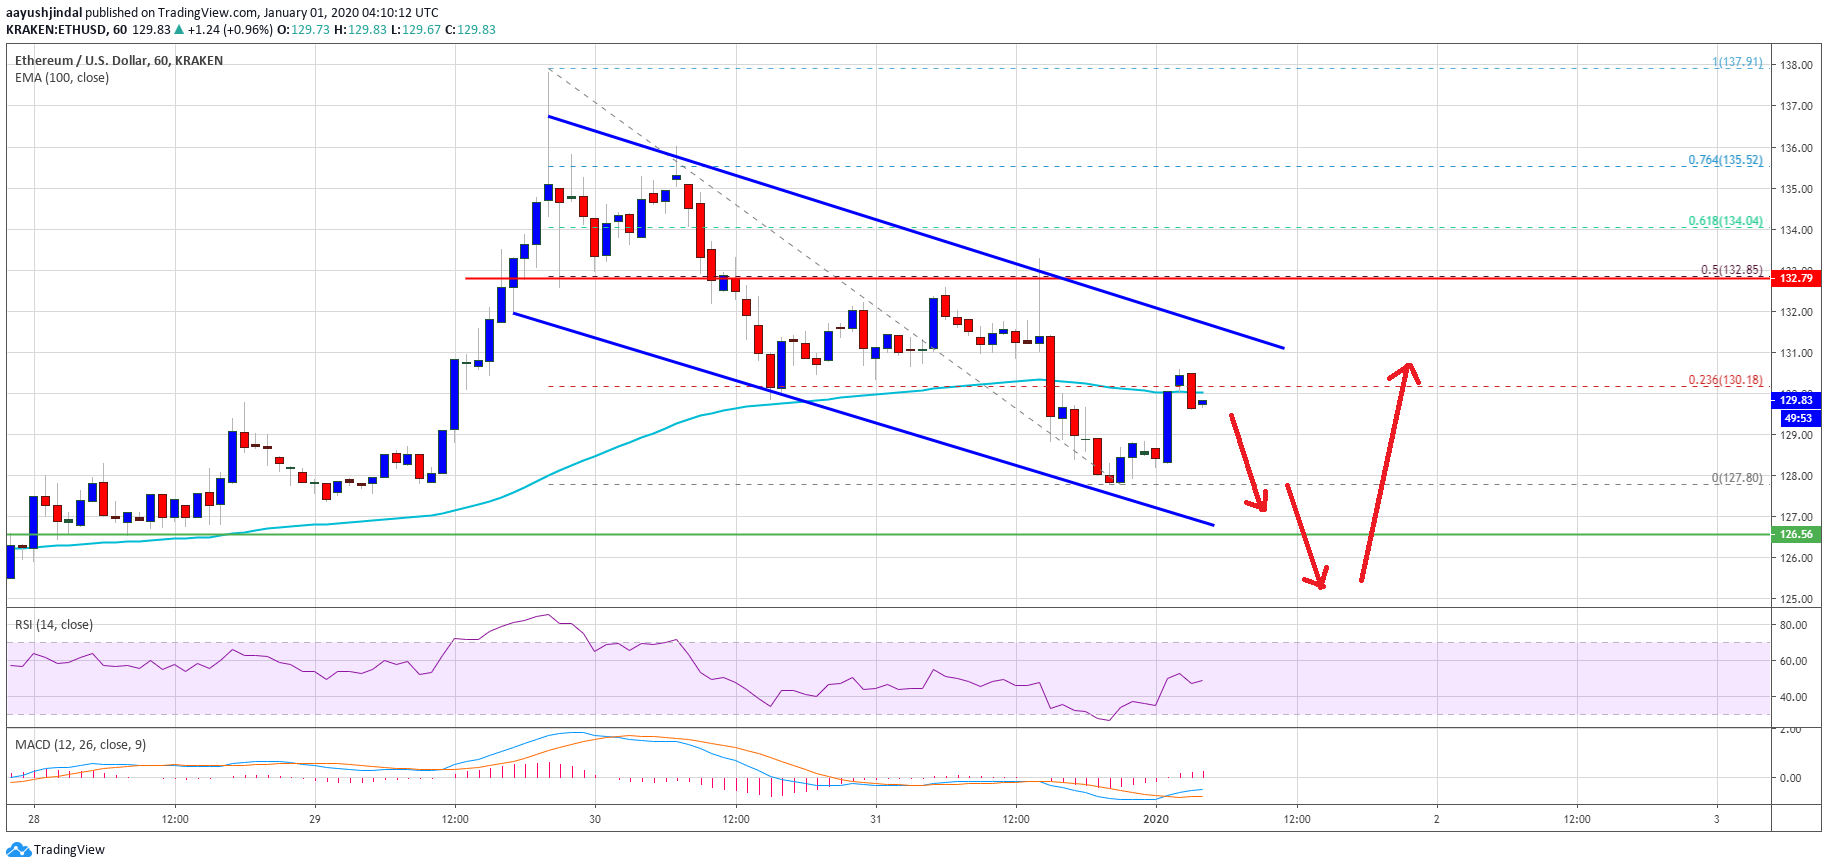 Ethereum PriceLooking at the chart, Ethereum price is slowly moving lower towards the $125 support area. The main support is near the $120 level, below which the price is likely to remain in a sustained downtrend in the coming days. Conversely, a clear break above $132 and $135 could start a strong rally.ETH Technical IndicatorsHourly MACD – The MACD for ETH/USD is slowly moving into the bullish zone.Hourly RSI – The RSI for ETH/USD is currently just below the 50 level.Major Support Level – $125Major Resistance Level – $132
Ethereum Watch
ETHEREUM and ICO TOKENS
