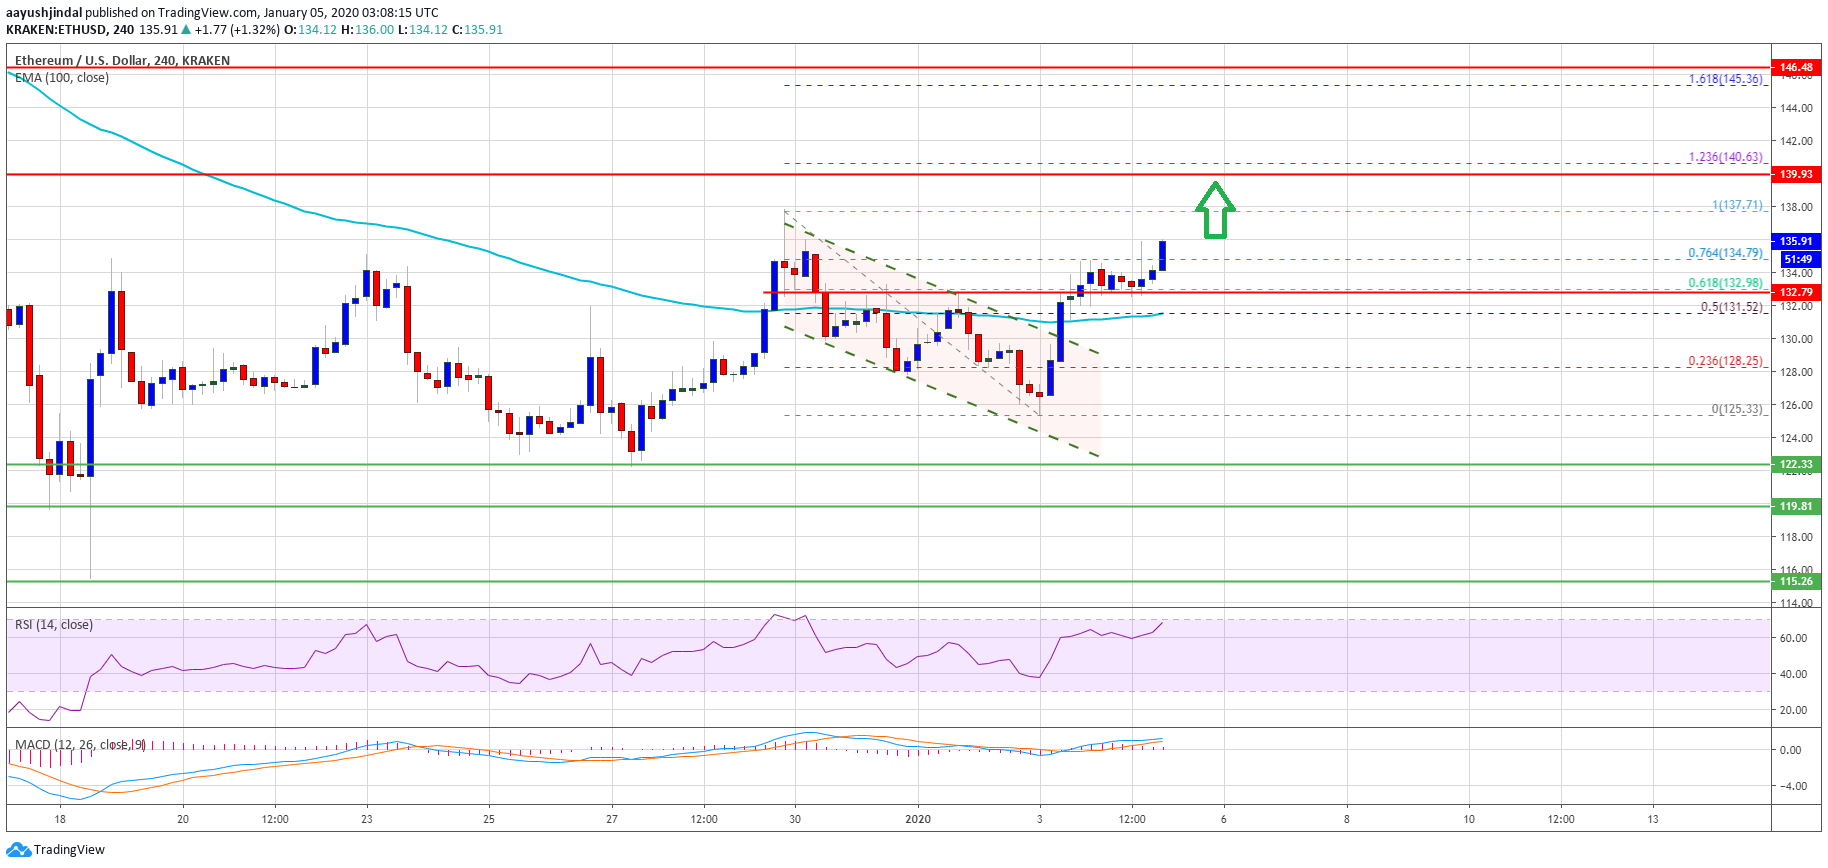
ETH price is gaining bullish momentum above the $132 resistance against the US Dollar.The price is trading above $135 and it recently traded to a new 2020 high.There was a break above a key declining channel or bullish flag with resistance near $130 on the 4-hours chart of ETH/USD (data feed via Kraken).The pair is likely to accelerate gains above the $140 and $142 resistance levels.Ethereum is surging above key hurdles against the US Dollar, similar to bitcoin. ETH price seems to be aiming a clear break towards the $145 and $150 resistances.Ethereum Price Going To $145This past week, Ethereum extended its decline to test the $125 support against the US Dollar. A strong support base formed near $125, resulting in a steady rise above the $128 resistance.Additionally, the price surpassed the 50% Fib retracement level of the key decline from the $138 high to $125 low. It opened the doors for more gains above $130 and the 100 simple moving average (4-hours).More importantly, there was a break above a key declining channel or bullish flag with resistance near $130 on the 4-hours chart of ETH/USD. The pair is now trading nicely above the $132 and $135 resistance levels.Besides, Ethereum climbed above the 76.4% Fib retracement level of the key decline from the $138 high to $125 low. Therefore, there are high chances of an upside continuation above the last swing high at $138.An immediate resistance is near the $140 level. It represents the 1.236 Fib extension level of the key decline from the $138 high to $125 low.However, the current momentum seems to be very positive, suggesting a clear follow through above the $142 resistance towards $145. Any further gains could lead the price towards the $150 and $155 resistance levels.What Could Cause Decline in ETH?On the other hand, if Ethereum price fails to surpass the $138 swing high, it could correct lower. The first key support is near the $132 level and the 100 simple moving average (4-hours).If the price fails to stay above the 100 SMA, it may perhaps continue to move down towards the $128 support level in the near term. The main supports are still near $125 and $122. Ethereum PriceThe above chart indicates that Ethereum price is trading in a positive bias, with high chances of more gains towards the $142 and $145 resistance levels.Technical Indicators4 hours MACD – The MACD for ETH/USD is gaining strength in the bullish zone.4 hours RSI – The RSI for ETH/USD is currently well above the 60 level.Major Support Level – $125Major Resistance Level – $138
