Ethereum gained momentum and broke the key $170 resistance and bitcoin rallied above $9,000. ETH price seems to be forming a larger trend and it could even clear $180.There were decent bullish moves in Ethereum above the $165 and $170 levels against the US Dollar.The price is up around 4% and it is likely to climb towards the $180 resistance.There is a key bullish trend line forming with support near $170 on the hourly chart of ETH/USD (data feed via Kraken).There could be a larger rally once the price clears the $180 resistance area.Ethereum Price Gaining Bullish MomentumIn the past few sessions, there were bullish moves in both bitcoin and Ethereum above $170 and $9,000 respectively against the US Dollar. ETH price settled above the $165 resistance area and the 100 hourly simple moving average.A new weekly high is formed near the $174 level and the price is currently trading with a bullish angle. Besides, there is a key bullish trend line forming with support near $170 on the hourly chart of ETH/USD.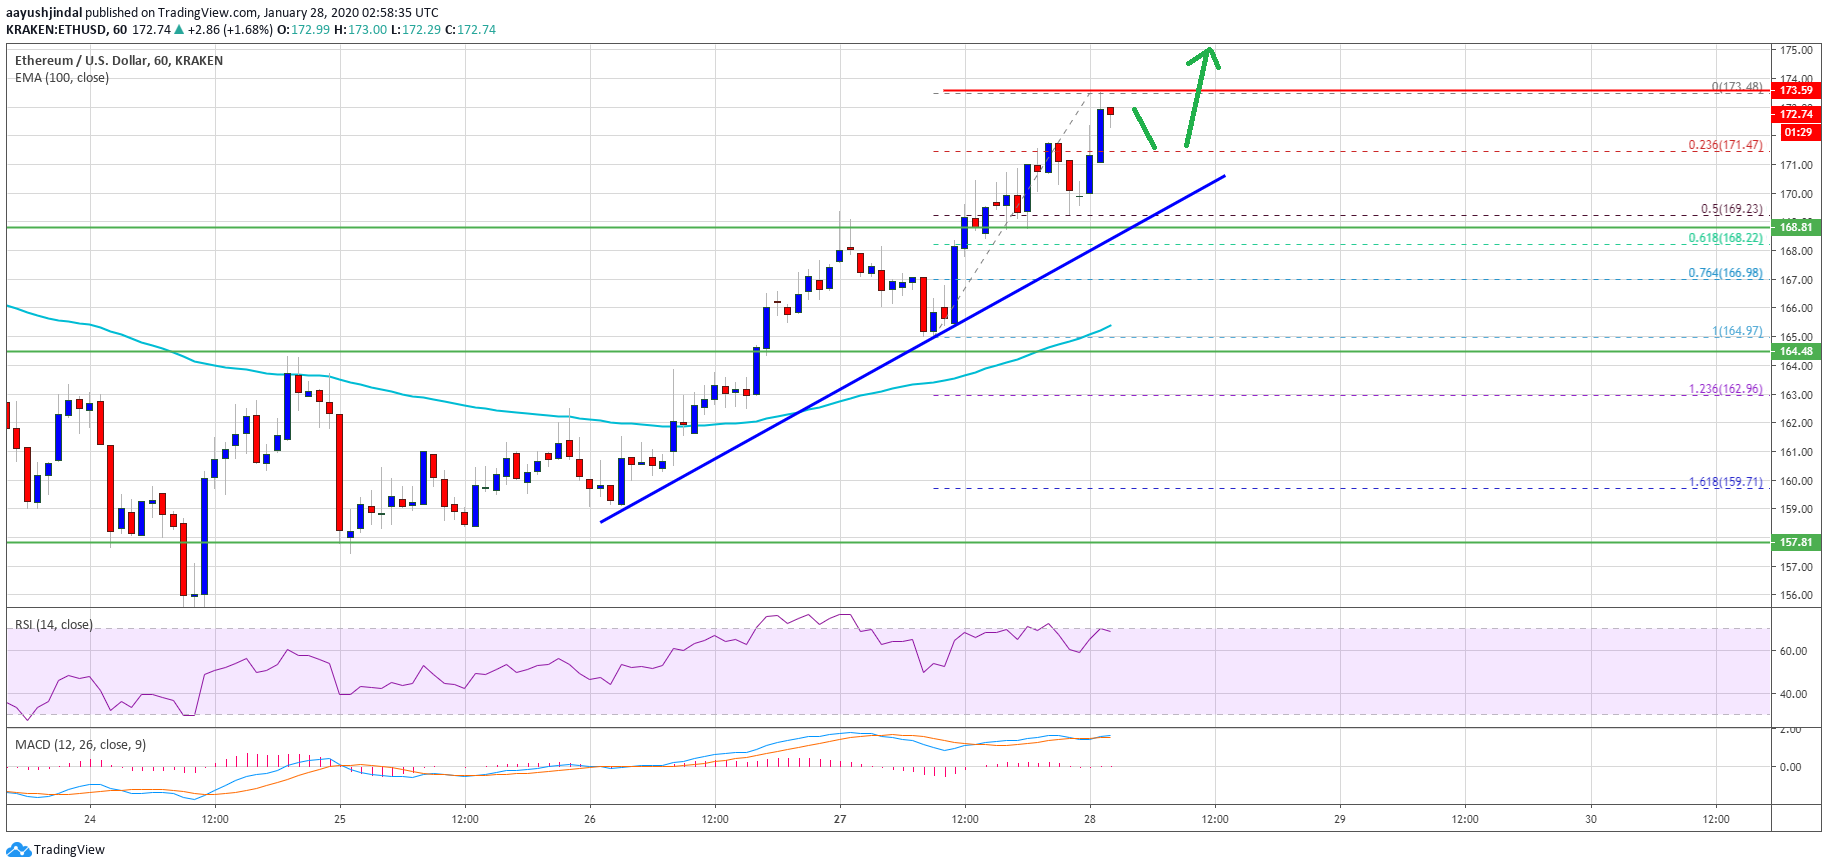 Ethereum PriceIf there is a clear break above the $174 area, the bulls are likely to aim the $178 and $180 resistance levels.More importantly, a clear break above the $180 resistance level could set the pace for a larger rally. In the mentioned case, the price is likely to surge towards the $200 level.Any further gains could lead the price towards the $220 pivot level in the coming days. An intermediate resistance is near the $215 level.Dips Remain SupportedIn the short term, there could be a minor correction in ETH from $174 or $178. An initial support is near the $172 level or the 23.6% Fib retracement level of the recent upward move from the $165 swing low to $174 high.The first major support on the downside is near the $170 level (the recent hurdle for the bulls). It is now near the bullish trend line and the 50% Fib retracement level of the recent upward move from the $165 swing low to $174 high.If Ethereum extends its decline below the $170 support level, it could start a downside extension towards the $165 support. The 100 hourly SMA is also near the $165 level to provide support in the near term.Technical IndicatorsHourly MACD – The MACD for ETH/USD is losing momentum in the bullish zone.Hourly RSI – The RSI for ETH/USD is currently correcting lower towards the 60 level.Major Support Level – $170Major Resistance Level – $178
Ethereum Watch
ETHEREUM and ICO TOKENS
