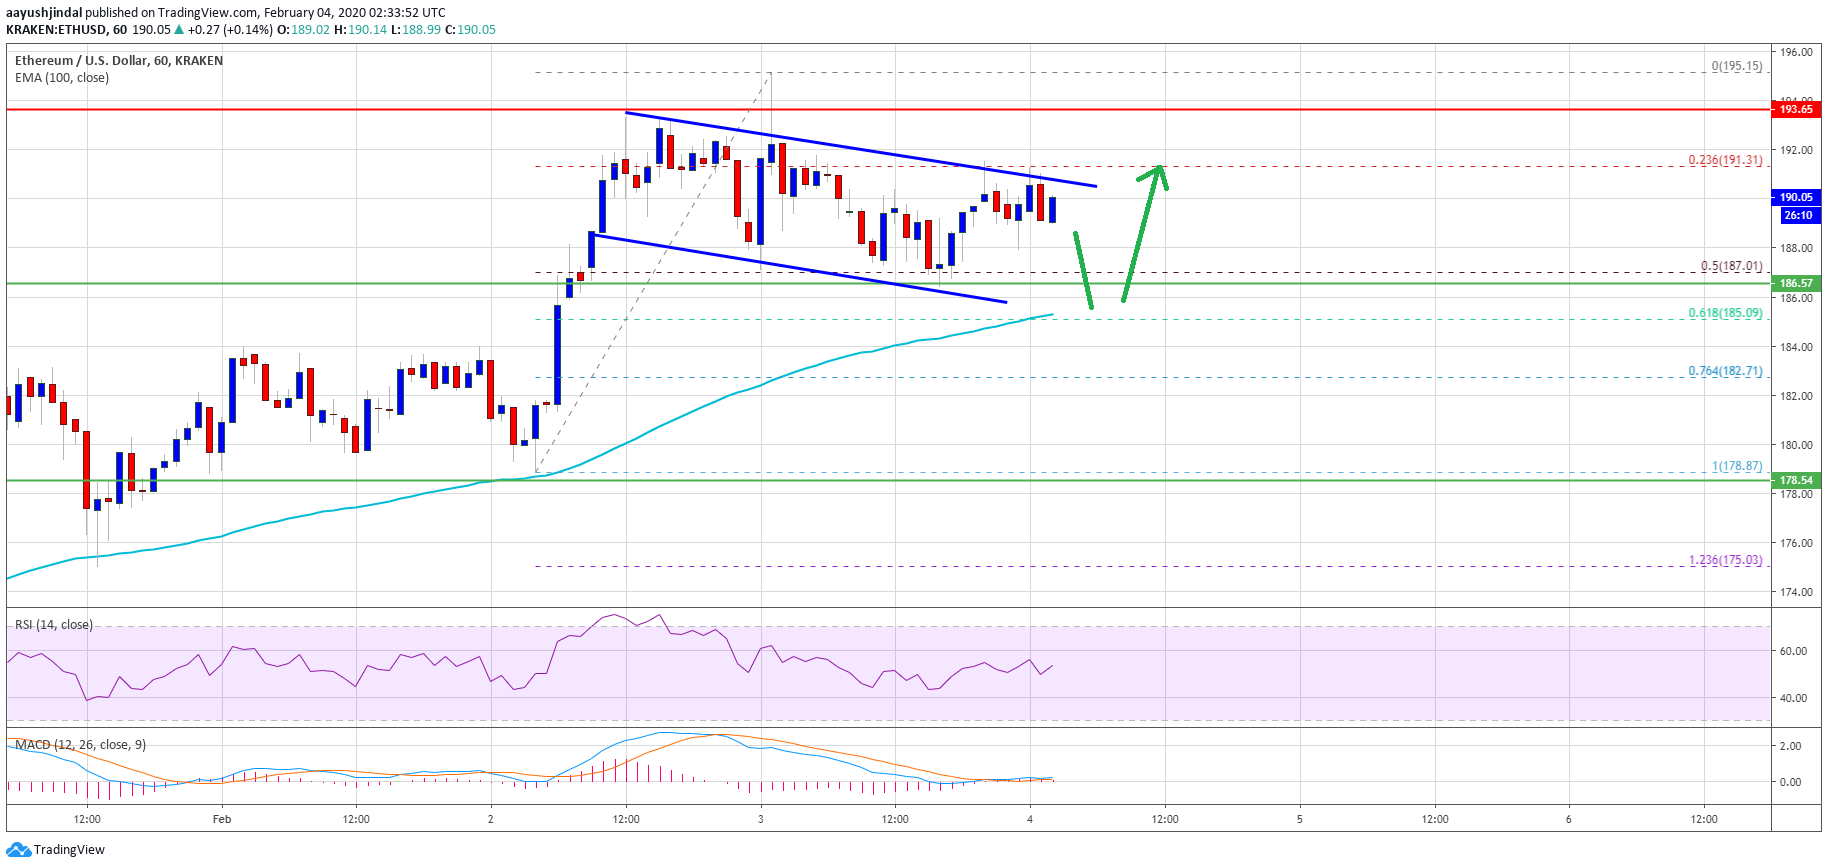
Ethereum price is trading in a positive zone above the $185 support against the US Dollar. ETH remains well bid and it is likely to bounce back from the 100 hourly SMA.Ethereum is currently correcting lower from the $195 yearly high against the US Dollar.The price is now approaching a couple of important supports near the $185 level.There is a bullish flag pattern forming with resistance near $192 on the hourly chart of ETH/USD (data feed via Kraken).Bitcoin price is struggling to settle above the $9,500 and $9,600 resistance levels.Ethereum Price Remains In UptrendRecently, we saw a nice upward move in Ethereum above the $190 level against the US Dollar. ETH price traded to a new yearly high at $195 and settled nicely above the 100 hourly simple moving average.It is now correcting lower from the $195 yearly high. There was a break below the 23.6% Fib retracement level of the recent wave from the $178 low to $195 high.Moreover, the price spiked below the $190 level, but it found support near the $185-$186 area. It seems like the 50% Fib retracement level of the recent wave from the $178 low to $195 high acted as a nice support.More importantly, there is a bullish flag pattern forming with resistance near $192 on the hourly chart of ETH/USD. If Ethereum bulls break the flag resistance near the $192 level, there could be a fresh increase above the $194 and $195 levels. Ethereum PriceIn the mentioned case, the price is likely to surpass the main $200 resistance area. The next key target for the bulls in the near term could be near the $220 level.Key Supports for ETHOn the downside, the first key support is near the $185 level. Additionally, the 100 hourly SMA is also positioned near the $185 level to provide support along with the 61.8% Fib retracement level of the recent wave from the $178 low to $195 high.If the bulls fail to keep the price above the $185 support, there is a risk of a larger decline in the near term. In the mentioned case, the bears are likely to aim a test of the $178 support level. Any further losses possibly will call for a test of $172.Technical IndicatorsHourly MACD – The MACD for ETH/USD is slowly moving in the bearish zone.Hourly RSI – The RSI for ETH/USD is currently just below the 50 level, with a minor bearish angle.Major Support Level – $185Major Resistance Level – $192
