Ethereum’s performance has been nothing short of a spectacle. The coin has risen from $115 to $230 in 53 days. The recent Bitcoin’s surge seems to have had a hand in pushing ETH higher. The altcoins seem to be in a short-term alt run, XRP, BCH, BSV and many other alts are pumping as Bitcoin breached $10,000. However, the rally needs to come to an end as ETH seems to have hit a roadblock.
Daily Chart

Source: ETH/USD TradingView
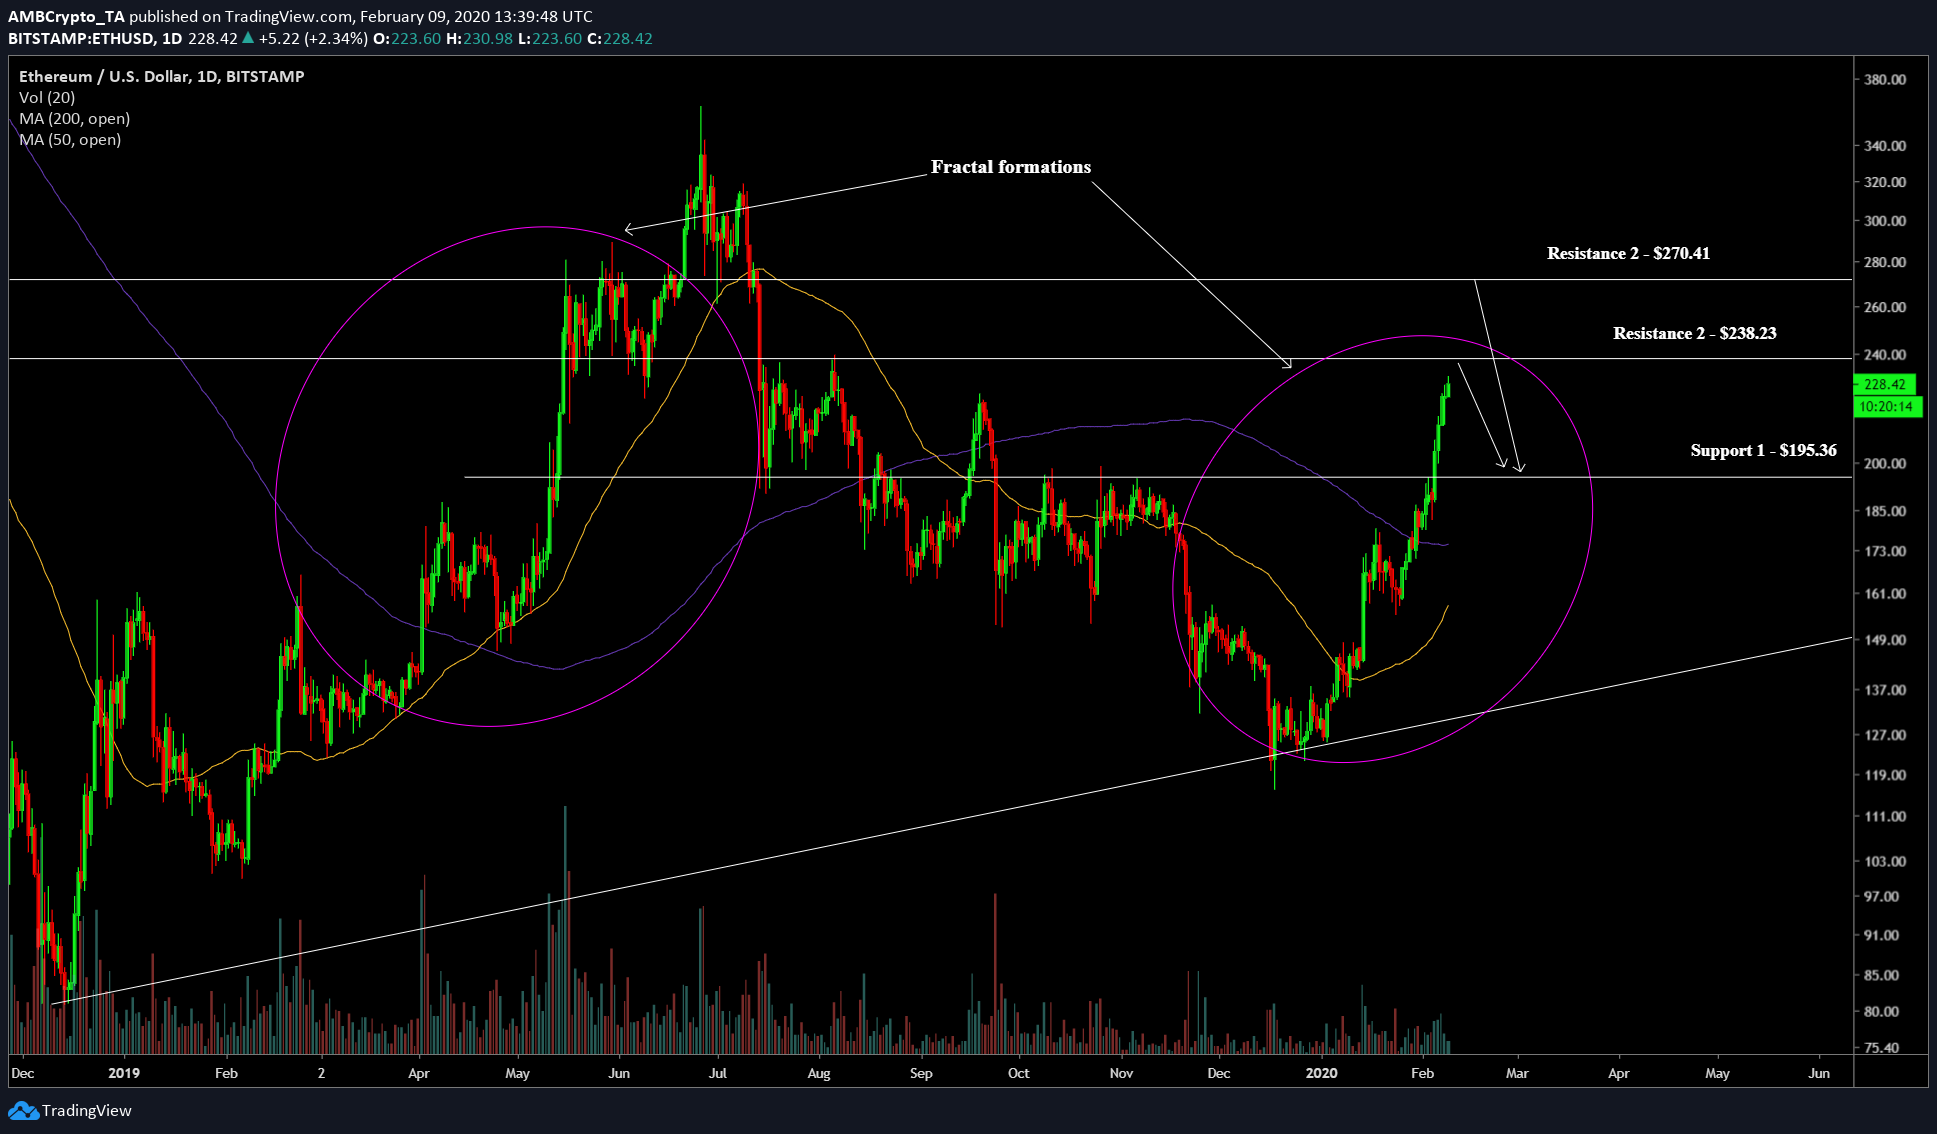
At press time, ETH was $227, this was a result of a 45% pump since January 26. Any further pumps in ETH’s price will hit a ceiling as seen in the chart above. The price surge is exponential, much similar to the one seen during March to June 2019. If the fractals are any indication, an immediate ceiling for ETH will be $238, if the bulls push through this, the next ceiling will be at $270. The eventual decline of ETH from either of these levels will push it down to support at $195.Furthermore, like XRP and other alts, the daily chart showed that the 200-DMA and the 50-DMA are getting closer to each other. Some alts, like BSV, have already undergone this, indicating that the price will pump if there is a FOMO. All of this depends on how Bitcoin will fare in the next couple of days. If Bitcoin surges exponentially, there is a chance that all the bearish scenario will be invalidated.
Weekly Chart

Source: ETH/USD TradingView
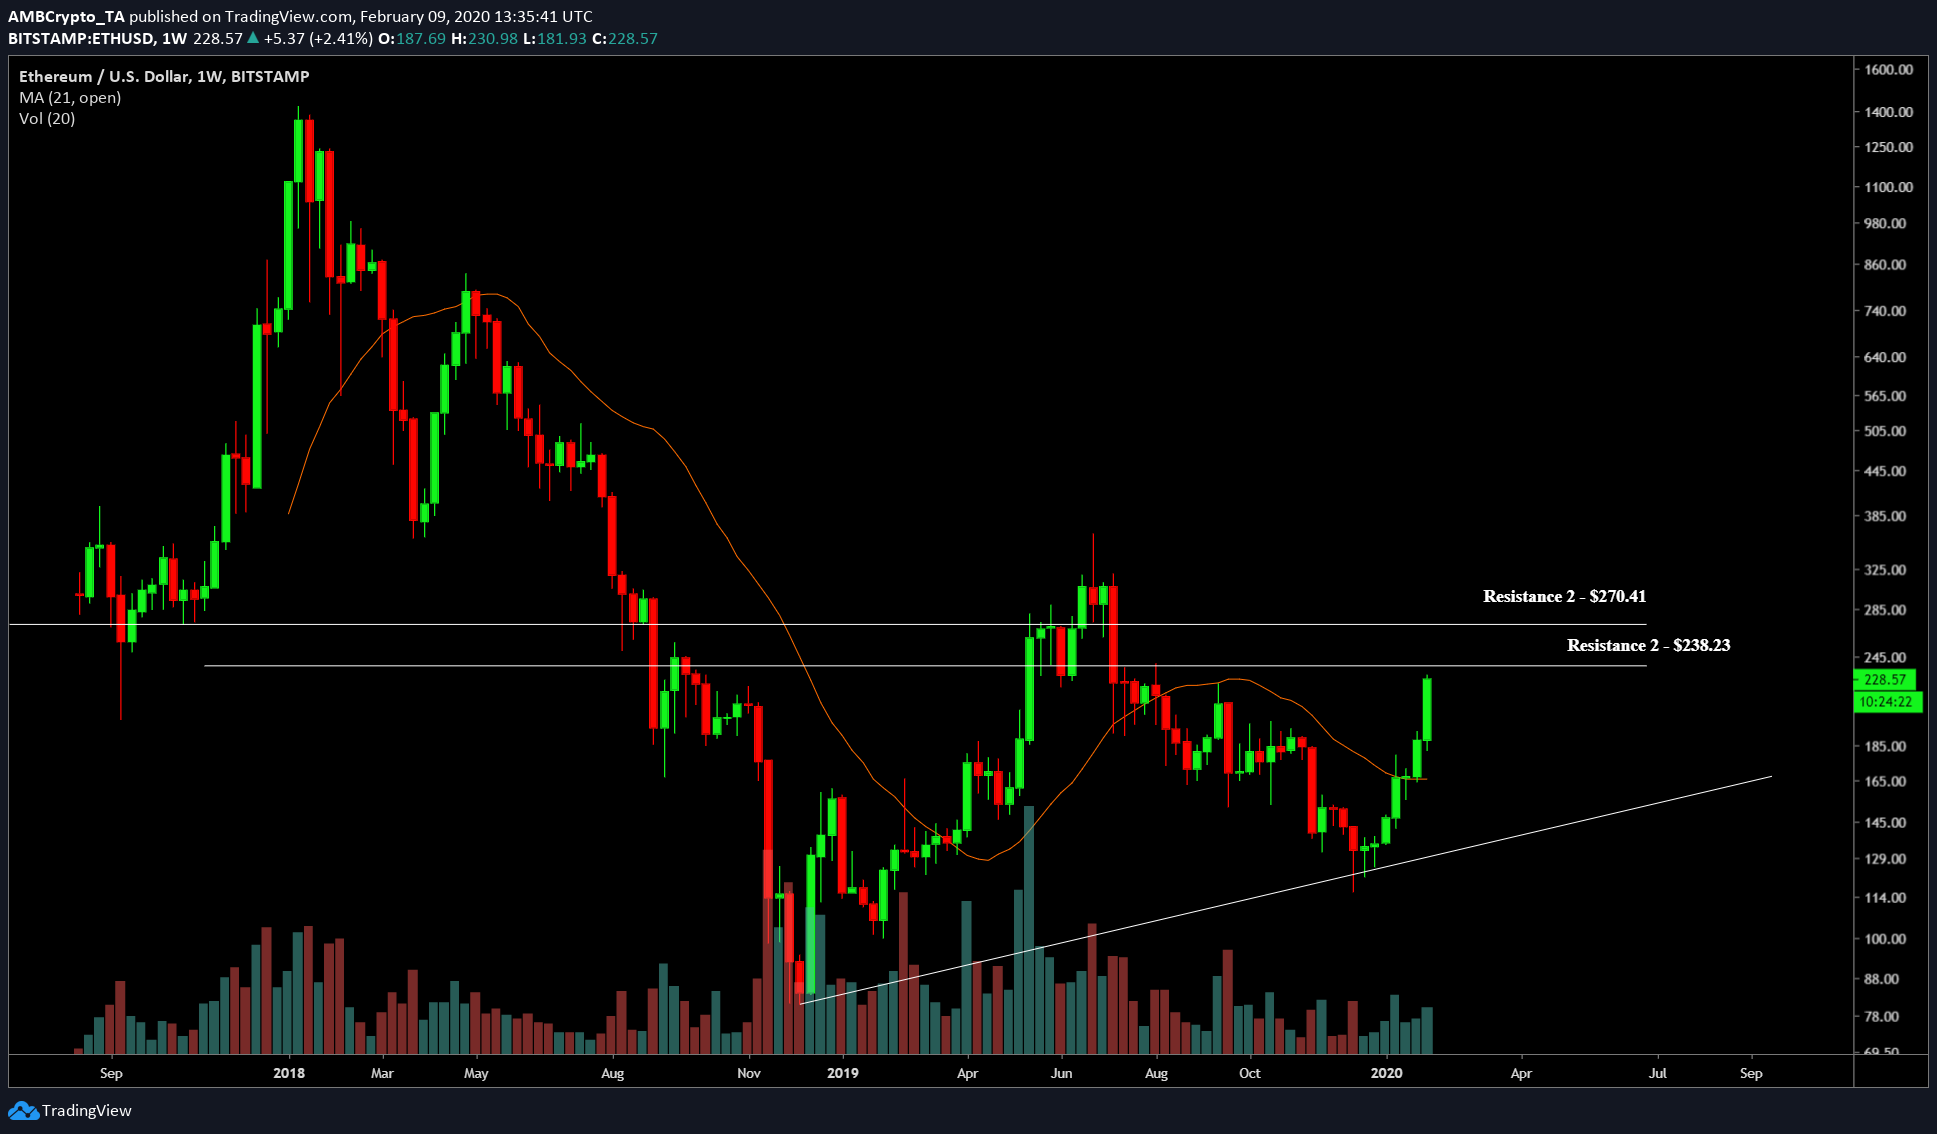
Unlike the daily chart, the weekly chart is much more bullish, especially with the formation of an ascending triangle. The upside to this, if the price breaks out is massive, ranging anywhere from 5% to 20% from the current price.
In addition, the price has also breached the 21 WMA, which is indicative of long term trends. Since the price has flipped this level, it indicates the formation of a bull run, especially since the price has also breached the 200-DMA.
Conclusion
The daily timeframe for ETH indicates upside up to 5% and $270, however, an eventual downtrend to support at $195. The weekly, however, shows a potential upside up of 20%.
