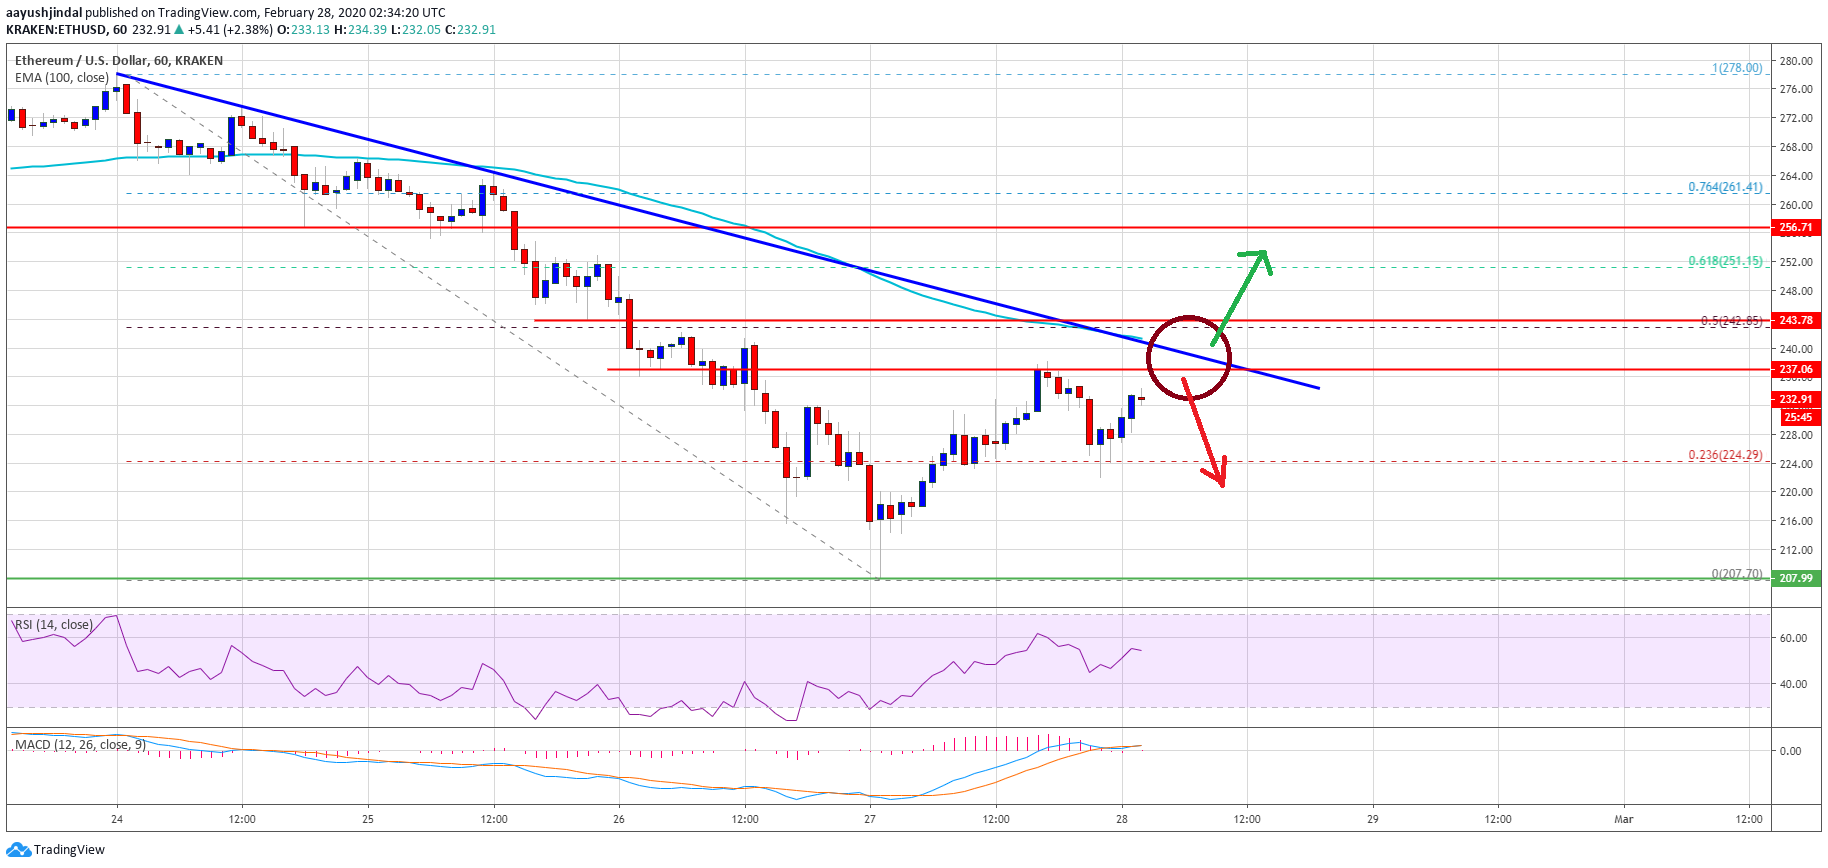
Ethereum started a strong recovery from the $208 swing low against the US Dollar. However, ETH price is likely to fail near $240 and it could resume its decline.Ethereum is up more than 8% and it climbed above the $230 level against the US Dollar.The price is still facing a lot of key hurdles near the $240 and $242 levels.Yesterday’s major bearish trend line is intact with resistance near $240 on the hourly chart of ETH/USD (data feed via Kraken).Bitcoin price is also recovering, but there are many hurdles near the $9,000 level.Upsides Remain Capped in EthereumIn the past three days, we saw a strong decline in Ethereum below the $250 and $240 levels against the US Dollar. ETH price even dived below the $220 support and traded close to the $205 support.A new weekly low is formed near $208 and the price is currently correcting higher. It recovered above the $220 level, plus the 23.6% Fib retracement level of the downward move from the $278 high to $208 swing low.Ethereum is currently facing hurdles near the $238 and $240 levels. More importantly, yesterday’s major bearish trend line is intact with resistance near $240 on the hourly chart of ETH/USD. Ethereum PriceTherefore, the price is clearly facing a couple of key barriers near the $238 and $240 levels. The 100 hourly simple moving average is also near the trend line and $240 to stop the current upward move.To move into a positive zone, the price must surpass the $240 and $242 resistance levels. The 50% Fib retracement level of the downward move from the $278 high to $208 swing low is also near the $242 level to act as a breakout zone.A successful break and close above $242 is likely to open the doors for a fresh increase. The next major resistance is seen near the $256 and $260 levels.Fresh DeclineIf Ethereum fails to continue above the $240 resistance and the trend line, there are chances of another decline. An initial support is near the $225 level, below which the price may perhaps slide towards the $210 level.The main supports are near the $205 and $200 levels, where the bulls are likely to take a strong stand.Technical IndicatorsHourly MACD – The MACD for ETH/USD is likely to move back into the bearish zone.Hourly RSI – The RSI for ETH/USD is about to move below the 50 level, with a bearish angle.Major Support Level – $225Major Resistance Level – $240
