
Ethereum has been considerably bullish since the start of March as the world’s 2nd largest crypto-asset appeared to marginally break away from its bearish rally. Ethereum was valued at $232, at press time, while its market cap remained just above $25 billion. ETH’s 24-hour trading volume was $17.39 billion, according to CoinMarketCap.
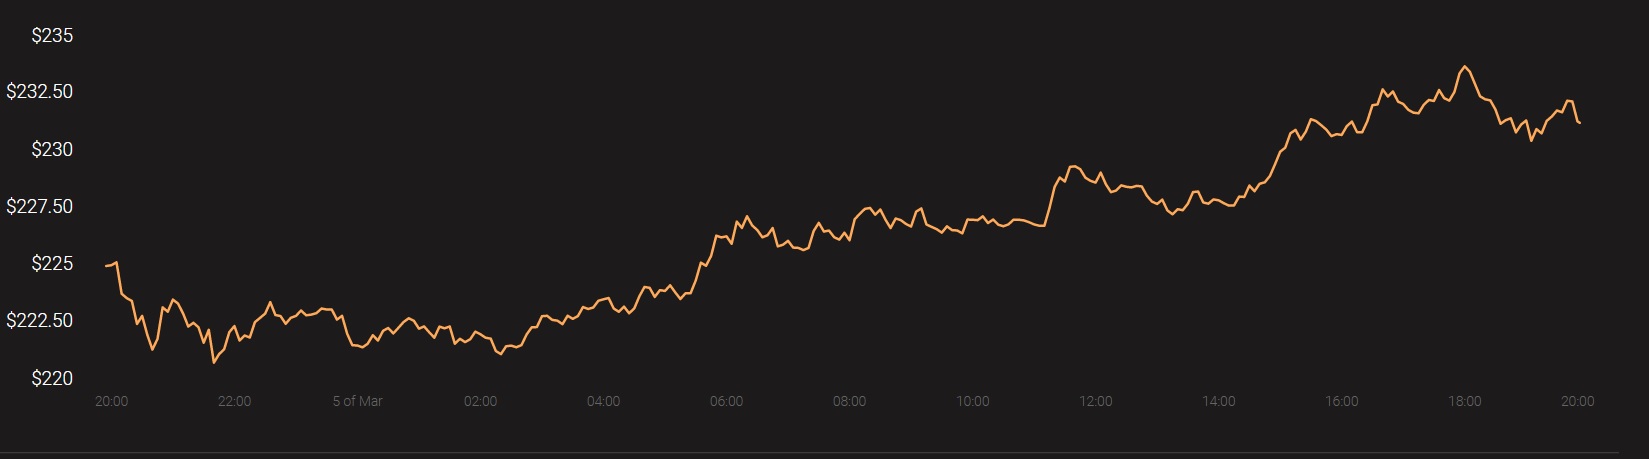
Source: Coinstats
1-hour chart
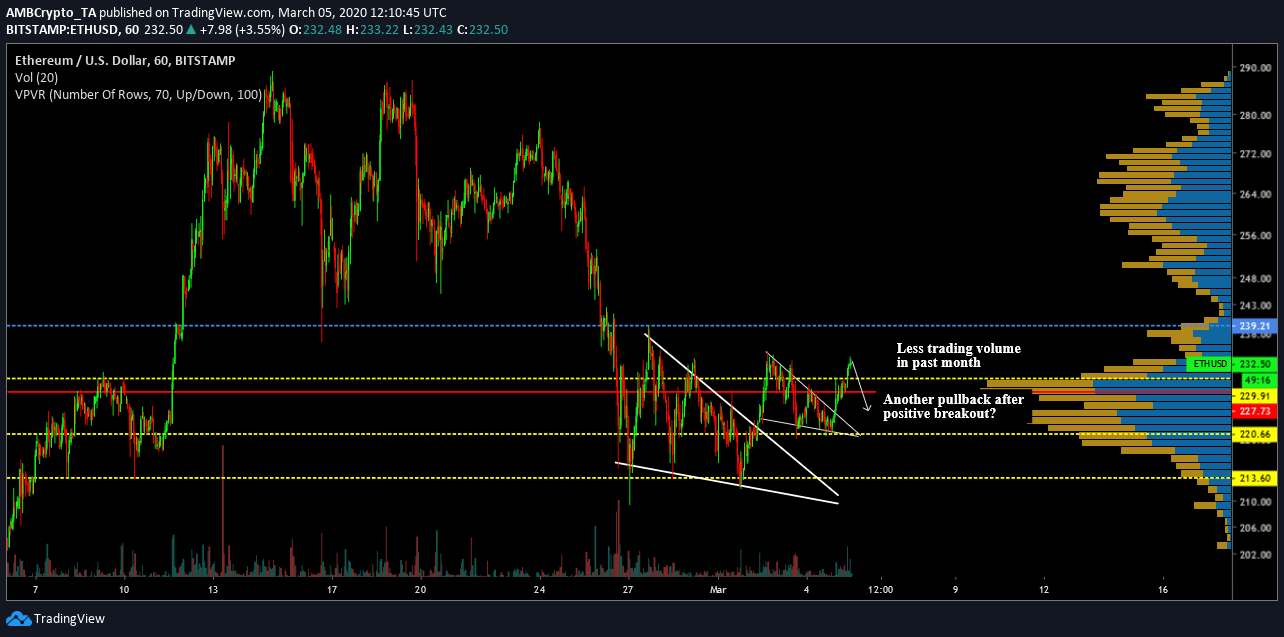
Source: ETH/USD on TradingView
Over the past 24-hours, Ethereum scaled by 5.47 percent, managing to breach the key resistance at $229. On analyzing Ethereum’s movement over the past week, it can be observed that the crypto-asset registered a bullish breakout twice from a falling wedge pattern.
The first falling wedge pattern began towards the end of February on the 27th and the breakout took place on 2nd March. Right after the breakout, Ethereum’s movement gave rise to another similar pattern and its break on 5th March 00:00 UTC allowed the token to surge above $229.
At press time, the coin was continuing to consolidate above $229, but there is a likely possibility that ETH will drop below $229 over the next few days.
Ethereum was at the time of writing trading at a range where the token lacked substantial volume over the past 30 days.
According to the VPVR indicator, the trading volume between the range of $220 and $229 has been high over the past month as a prominent sideways movement was exhibited in the charts. The Point-of-Control for the volume is at immediate support $229 so theoretically, ETH should bounce back from a re-test at the support levels.
However, the bearish momentum over the previous month cannot be dismissed just yet, with consolidation at a higher range still absent.
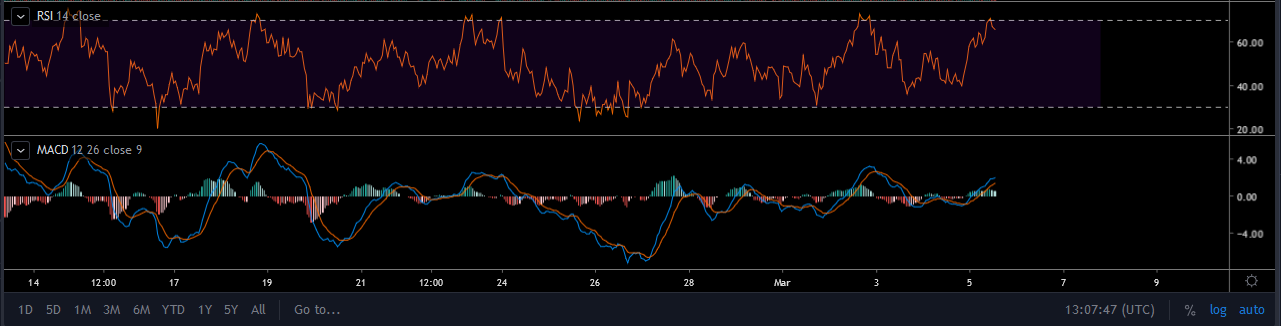
Source: TradingView
The Relative Strength Index or RSI indicated a downturn at press time, improving the likelihood of Ethereum dropping below $229 again. The MACD line remained bullish at the moment, but a majority of its current rally is due to the 5.47% hike over the day.
Conclusion
The market could be on the brink of breaking away from the short-term bearish rally as a consolidation above $200 is a good sign for the second-largest digital asset. However, another dip is in the cards before the strong bullish rally can surface and dictate an inclined trajectory for the coin.