
The last couple of days in the month of April laid down the foundation for Ethereum’s rally in May, but the world’s largest altcoin has been rather disappointing over the past week. After hiking by 15 percent on 30 April, ETH’s valuation plunged by over 5.66 percent over the last 6 days.
With bullish momentum declining on the charts, ETH might be looking at further depreciation in the market.
Ethereum 12-hour chart
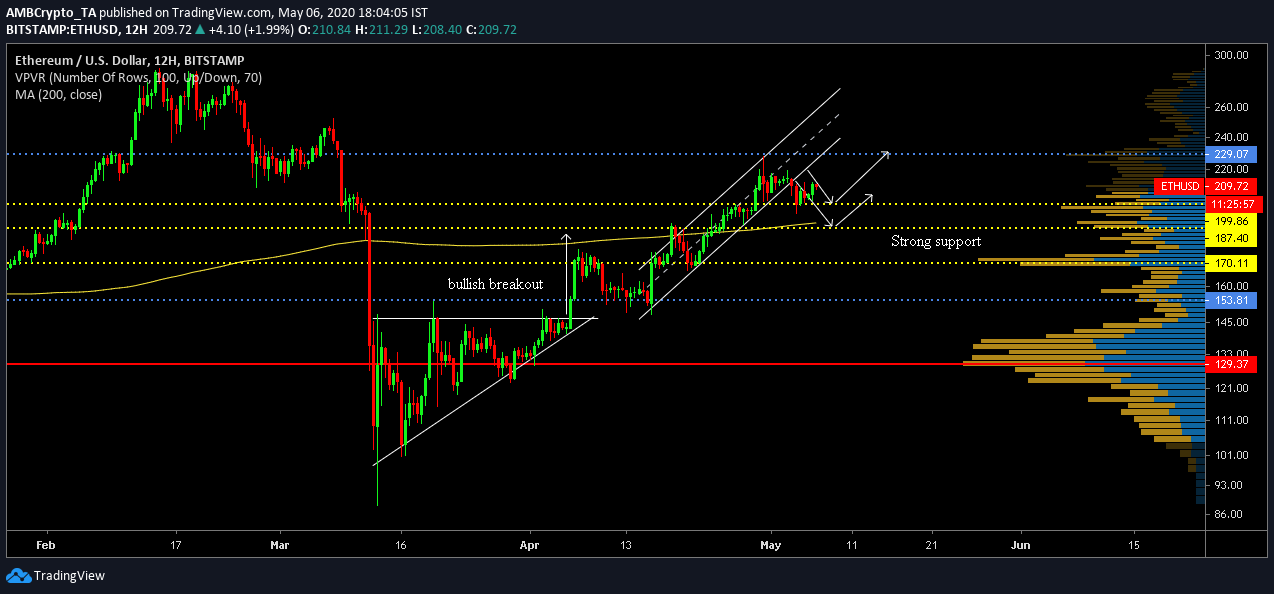
Since 12 March, Ethereum’s valuation has been on a steady incline and over the course of the past few months, the crypto-asset has followed the trend under two different patterns.
Initially, the crypto-asset’s movement gave rise to the formation of an ascending triangle, one that underwent a strong bullish breakout on 6 April. Although corrections followed thereafter, the price continued to ascend following the pullback.
Between 15 April and 2 May, Ethereum continued to mediate between the pattern of an ascending channel, with a breakout soon taking place on 3 May.
Considering a pullback is imminent after the breach of the pattern, ETH could possibly re-test support at $199 or $187 over the next couple of weeks. It is interesting to note that the crypto-asset has been able to consolidate above $200 for over a week, something that may suggest that the support at $199 would be strong.
However, as bullish momentum in the market continues to fade away, higher selling pressure may inevitably push Ethereum under the $200-mark again.
Long-term support at $170 is unlikely to be tested, but the VPVR suggested that the strongest trading volume remained evident at $170 since the start of 2020. The 200-Moving Average (yellow line) continued to act as resistance on the charts, at the time of writing.
Ethereum-Gann Fan outlook
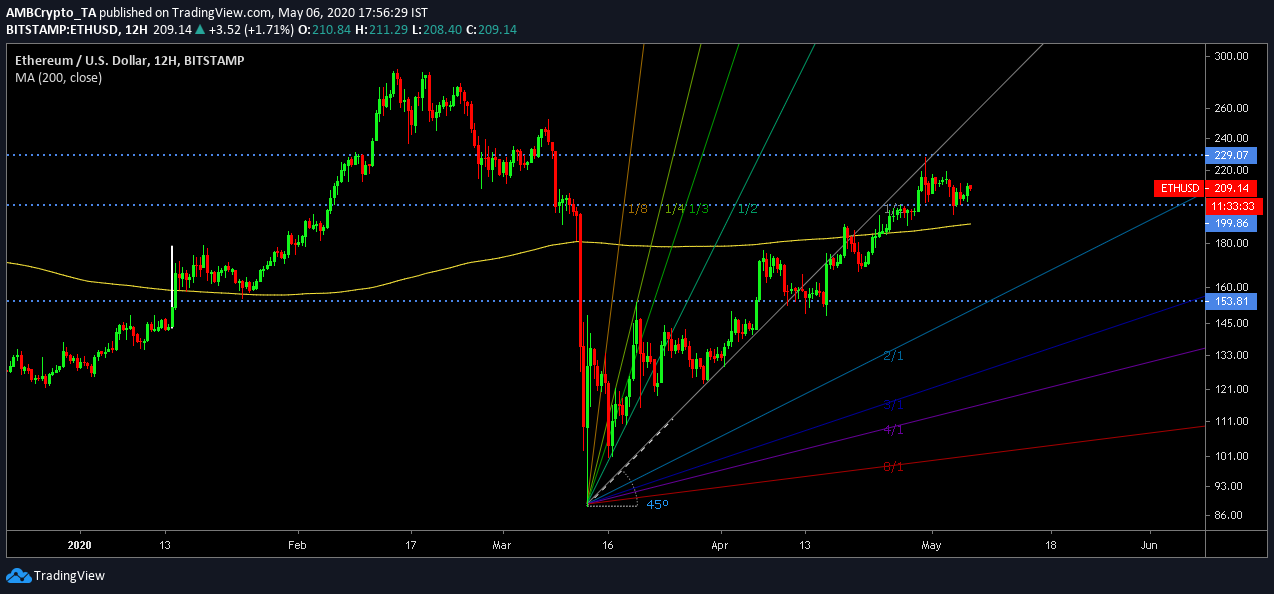
Source: ETH/USD on Trading View
On the other hand, Ethereum’s long-term outlook still remains significantly bearish. The rally on 29 April did not push ETH’s price past the 1/1 ratio line in the Gann Fan indicator. According to the above analysis, Ethereum might just remain under its resistance at $230 over the course of May, before any signs of a strong bullish rally.
Conclusion
Ethereum is possibly priced-in at a top $230 and a drop below $200 seems most likely. A drop down to $187 is foreseeable whereas the re-test at $170 cannot be ignored as well.