
Ethereum surged significantly over the last 24-hours, a movement that catapulted the altcoin’s price to $251.7, at the time of writing. While its recent gains weren’t enough to recover the losses incurred during the crash, the coin, however, might attract another bullish swing in the near-term.
Ethereum 1-Day Chart
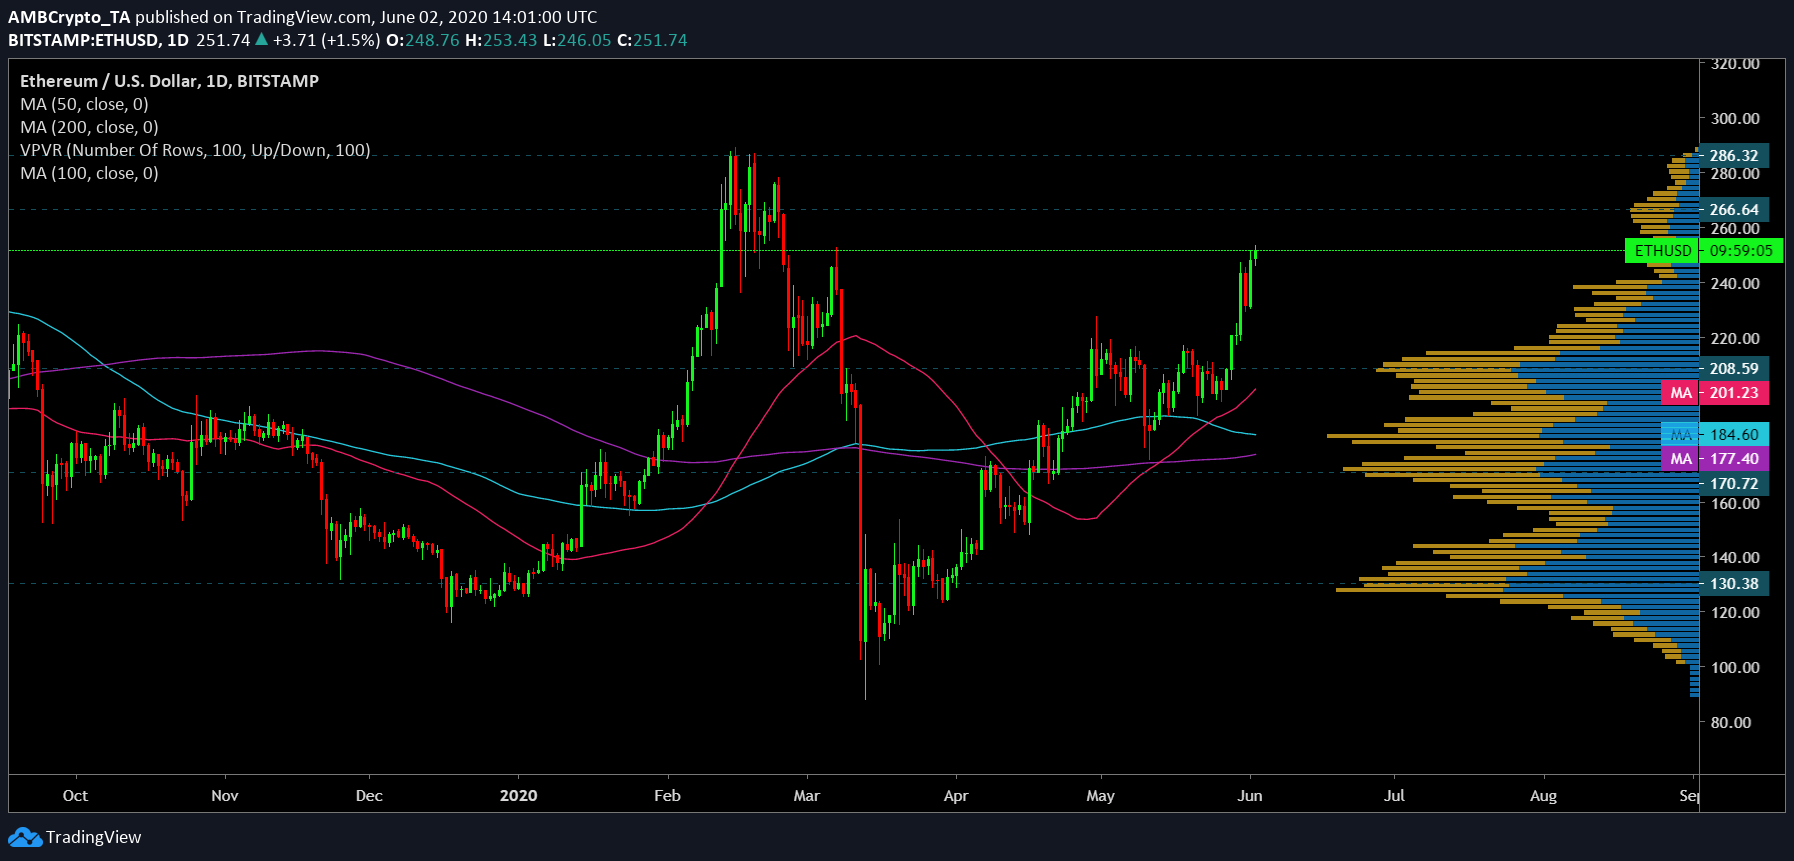
Ethereum just underwent a major breakout to the positive side. Driven by the stunning market surge, the coin’s price was catapulted close to the 2020 highs the world’s largest altcoin had posted just weeks before the crash. The daily moving averages predicted a potential breakout to the positive side as the 50 DMA [Pink] underwent a golden cross with the 200 DMA [Purple] in the second week of May. The divergence since then has been on the rise, pointing towards a bullish break.
Additionally, the 50 DMA underwent a bullish crossover with the 100 DMA [Blue] on the 23rd of May and the gauge between the two was also observed to be increasing. Further validating the presence of a bullish outlook was the placement of the all the three daily moving averages below the ETH price candles.
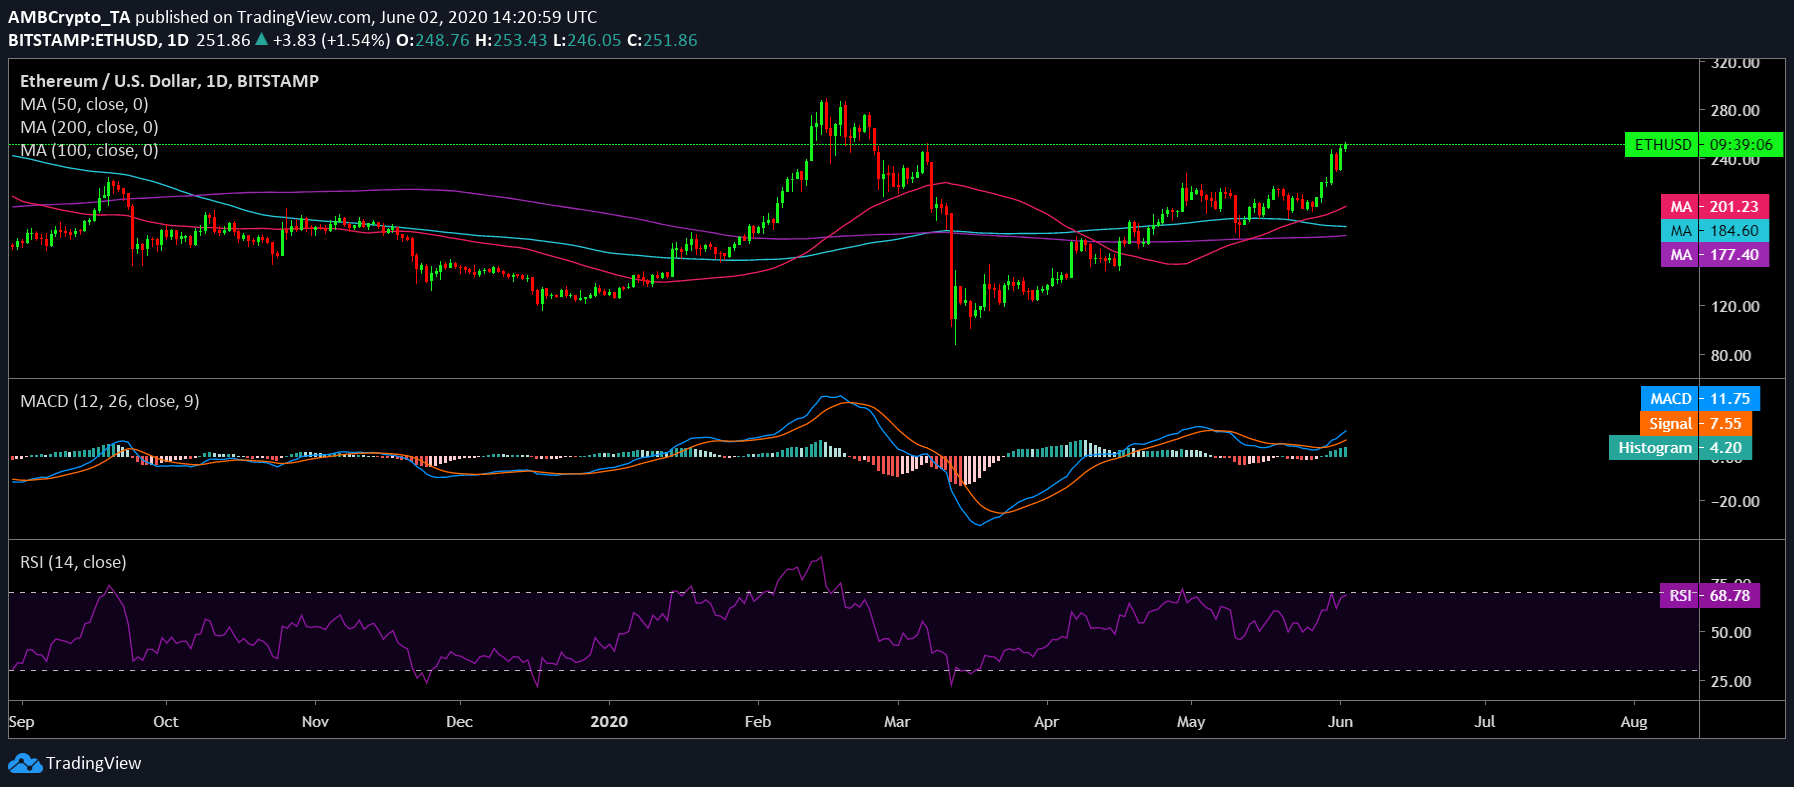
Even the indicators pointed towards a bullish price action in the near-term. The MACD line was well above the signal line, picturing a bullish trend for the coin. Additionally, the RSI above the 50-median neutral line suggested an increase in buying pressure among traders in the ETH market.
Case 1
A potential bullish breakout was predicted by the attached charts. If this materializes, the coin could breach $266.64, a level that has seen high trading activity, as depicted by the VPVR indicator. If the coin were to gain necessary momentum, ETH could climb all the way to $286.3.
Case 2
The chances of a breach to the negative side appeared to be bleak. On closer inspection, it can be seen that the coin has been severely resisted at the now-breached level of $215, a level which acted as strong support after the latest upsurge. Other critical points that supported the coin, $208.6, $170.7, and $130.3, are all levels that have seen high trading activity.
Conclusion
A potential bullish breakout would push the coin to breach $266.64 and $286.3, respectively, while its support levels stood firm at $208.6, $170.7, and $130.3.
Your feedback is important to us!