
Disclaimer: This article attempts to foresee Ethereum’s price action over the next three weeks, leading up to a potential breakout in the second week of July
Following the latest swing towards the upside, Ethereum‘s price climbed over $245 on the charts. However, as it surged higher to breach its crucial resistance, it fell short of the critical $250 mark. The world’s largest altcoin was soon dragged down to the press time price level of $242.38. Despite the pullback, however, positive revival could be on the cards for the altcoin in the long-term.
Ethereum Daily Chart
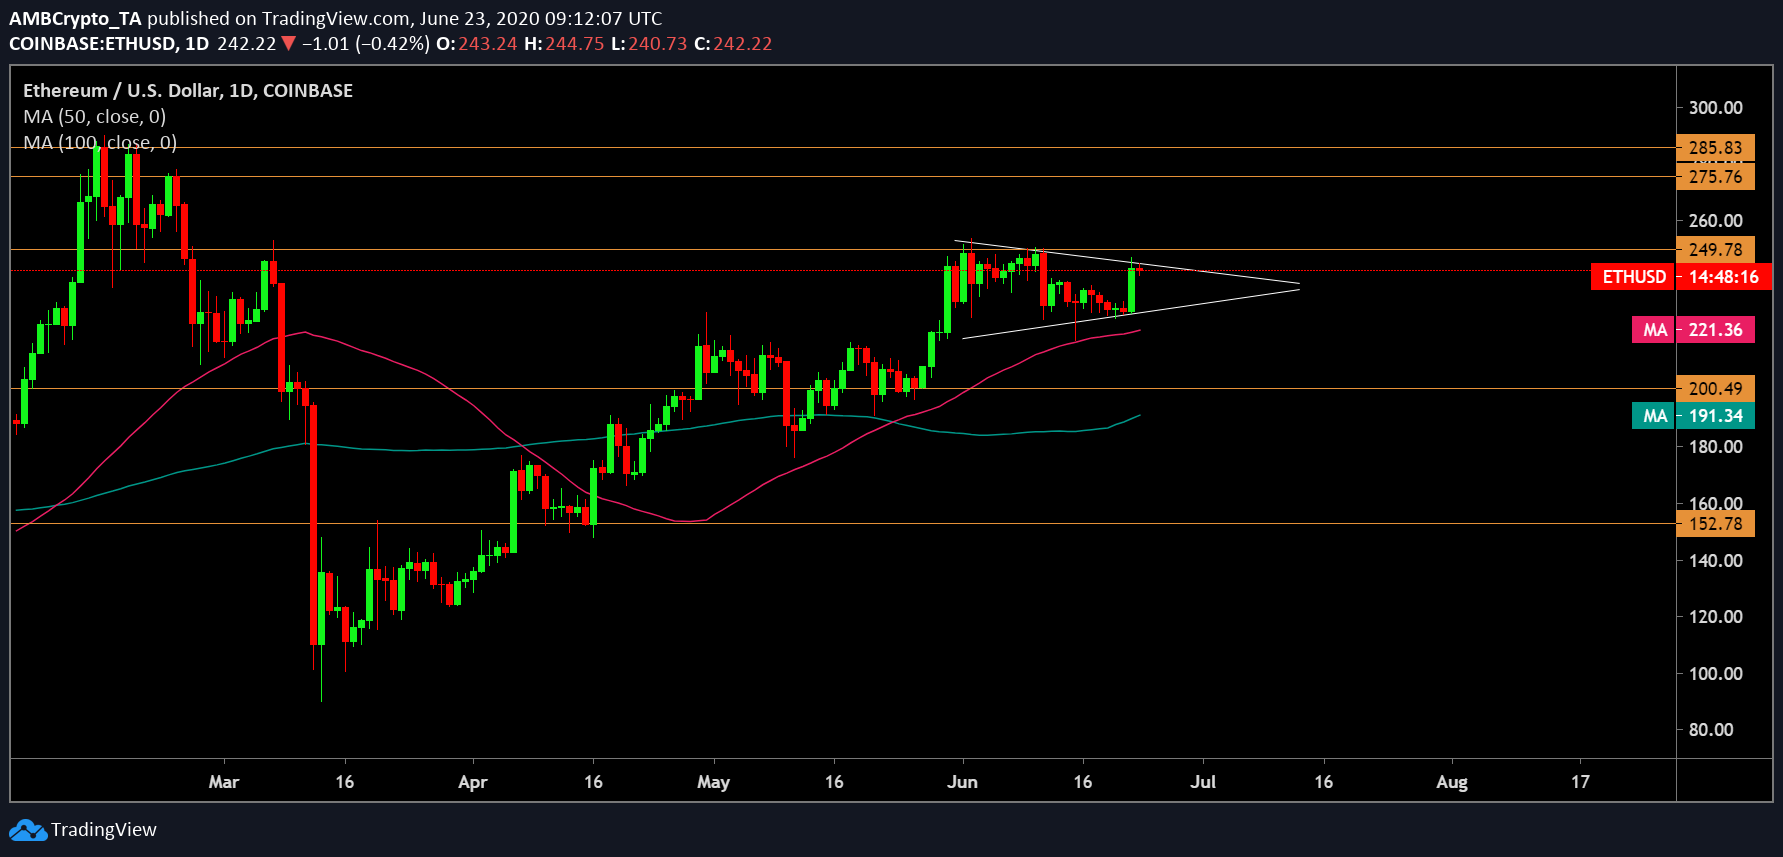
Ethereum’s price candles were found to be oscillating between the two trendlines of a symmetrical triangle pattern. In fact, completion of this pattern was expected to transpire in the second week of July, following which a breakout could be anticipated on either side.
The daily moving averages aligned with the bullish phase. The 50 DMA [Pink] underwent a bullish crossover with the 100 DMA [Blue] in the second week of May. The gauge has been expanding since then. Additionally, the two daily moving averages were firmly supporting the coin’s price action, preventing it from falling any further as it rested below the price candles. This further validated the presence of bullishness in the ETH market.
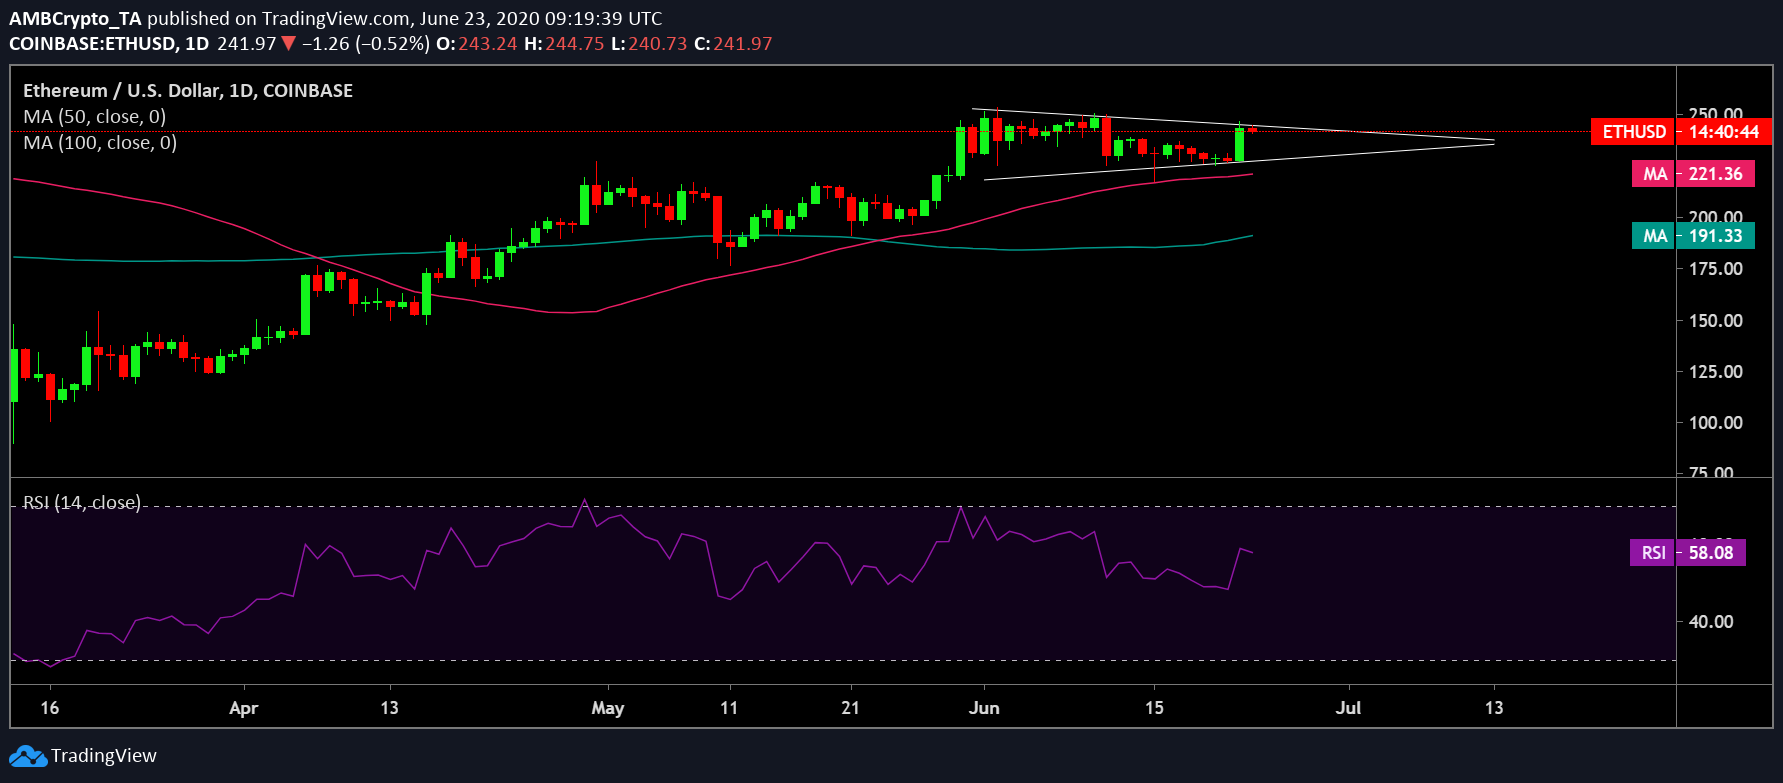
The RSI was well above the 50-median line as it spiked following the latest price action of the second-largest cryptocurrency. This underlined positive sentiments of high buying pressure among investors in the ETH market, ahead of the major upgrade that is Ethereum 2.0.
Correlation
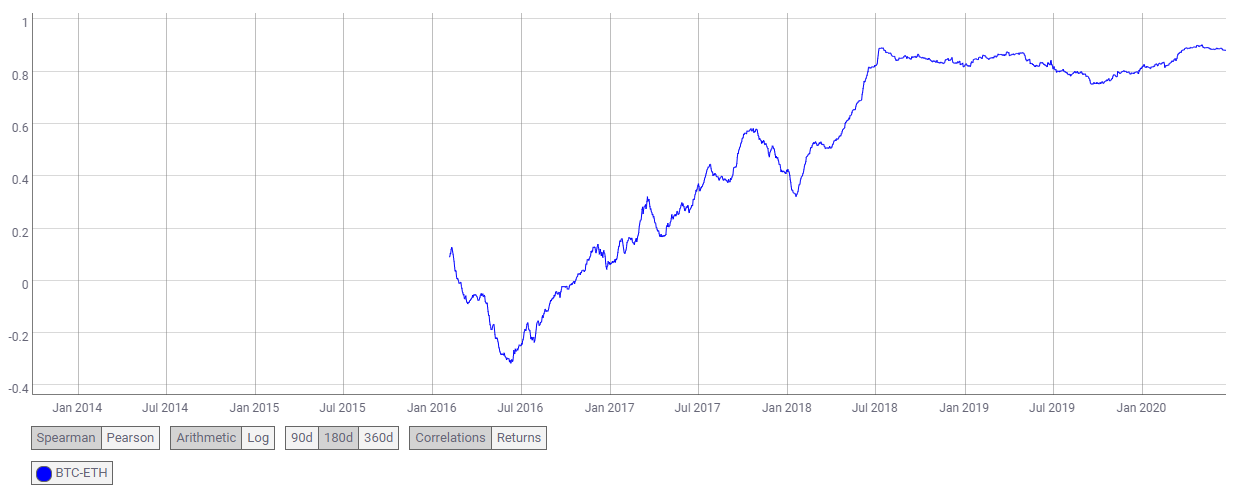
Altcoins have historically mimicked Bitcoin’s price action. ETH’s latest surge evidenced the same. At the time of writing, the BTC-ETH correlation coefficient stood at 0.88. This essentially highlighted that Bitcoin’s surge could be a crucial catalyst for improving the valuation of Ethereum.
Conclusion
A potential bullish breakout was supported by the placement of the two daily moving averages, as well as the RSI indicator. Up until the breakout, ETH is predicted to consolidate within the range bound by the symmetrical triangle. Following this, a breakout could potentially lead to a breach of the first resistance point at $249.78.
If the trend gains further momentum, it could climb to $275 and subsequently, $285, levels unseen since February’s highs. The coin found immediate support by the 50 DMA at $221. Other support points stood at $200.4, along with the 100 DMA at $191, respectively.
Your feedback is important to us!