
Ethereum rallied recently above the $235 resistance region against the US Dollar. ETH is currently correcting gains, but the $230 support might act as a strong buy zone.
- Ethereum is trading in a positive zone above the $230 and $232 levels.
- The price rallied above the $240 level and it is currently correcting gains from $244.
- There was a break below a connecting bullish trend line with support near $240 on the hourly chart of ETH/USD (data feed via Kraken).
- The pair is likely to find a strong buying interest near the $232 and $230 levels in the near term.
Ethereum Price Turns Green
In the past few hours, there was a strong bullish price action in Ethereum against the US Dollar. ETH price gained traction and rallied above the $230 and $235 resistance levels.
The upward move was such that the price even spiked above the $240 level and it settled above the 100 hourly simple moving average. A new weekly high is formed near $244 and the price is currently correcting lower.
There was a break below the $240 level, plus the 23.6% Fib retracement level of the recent rally from the $223 swing low to $244 high. Moreover, there was a break below a connecting bullish trend line with support near $240 on the hourly chart of ETH/USD.
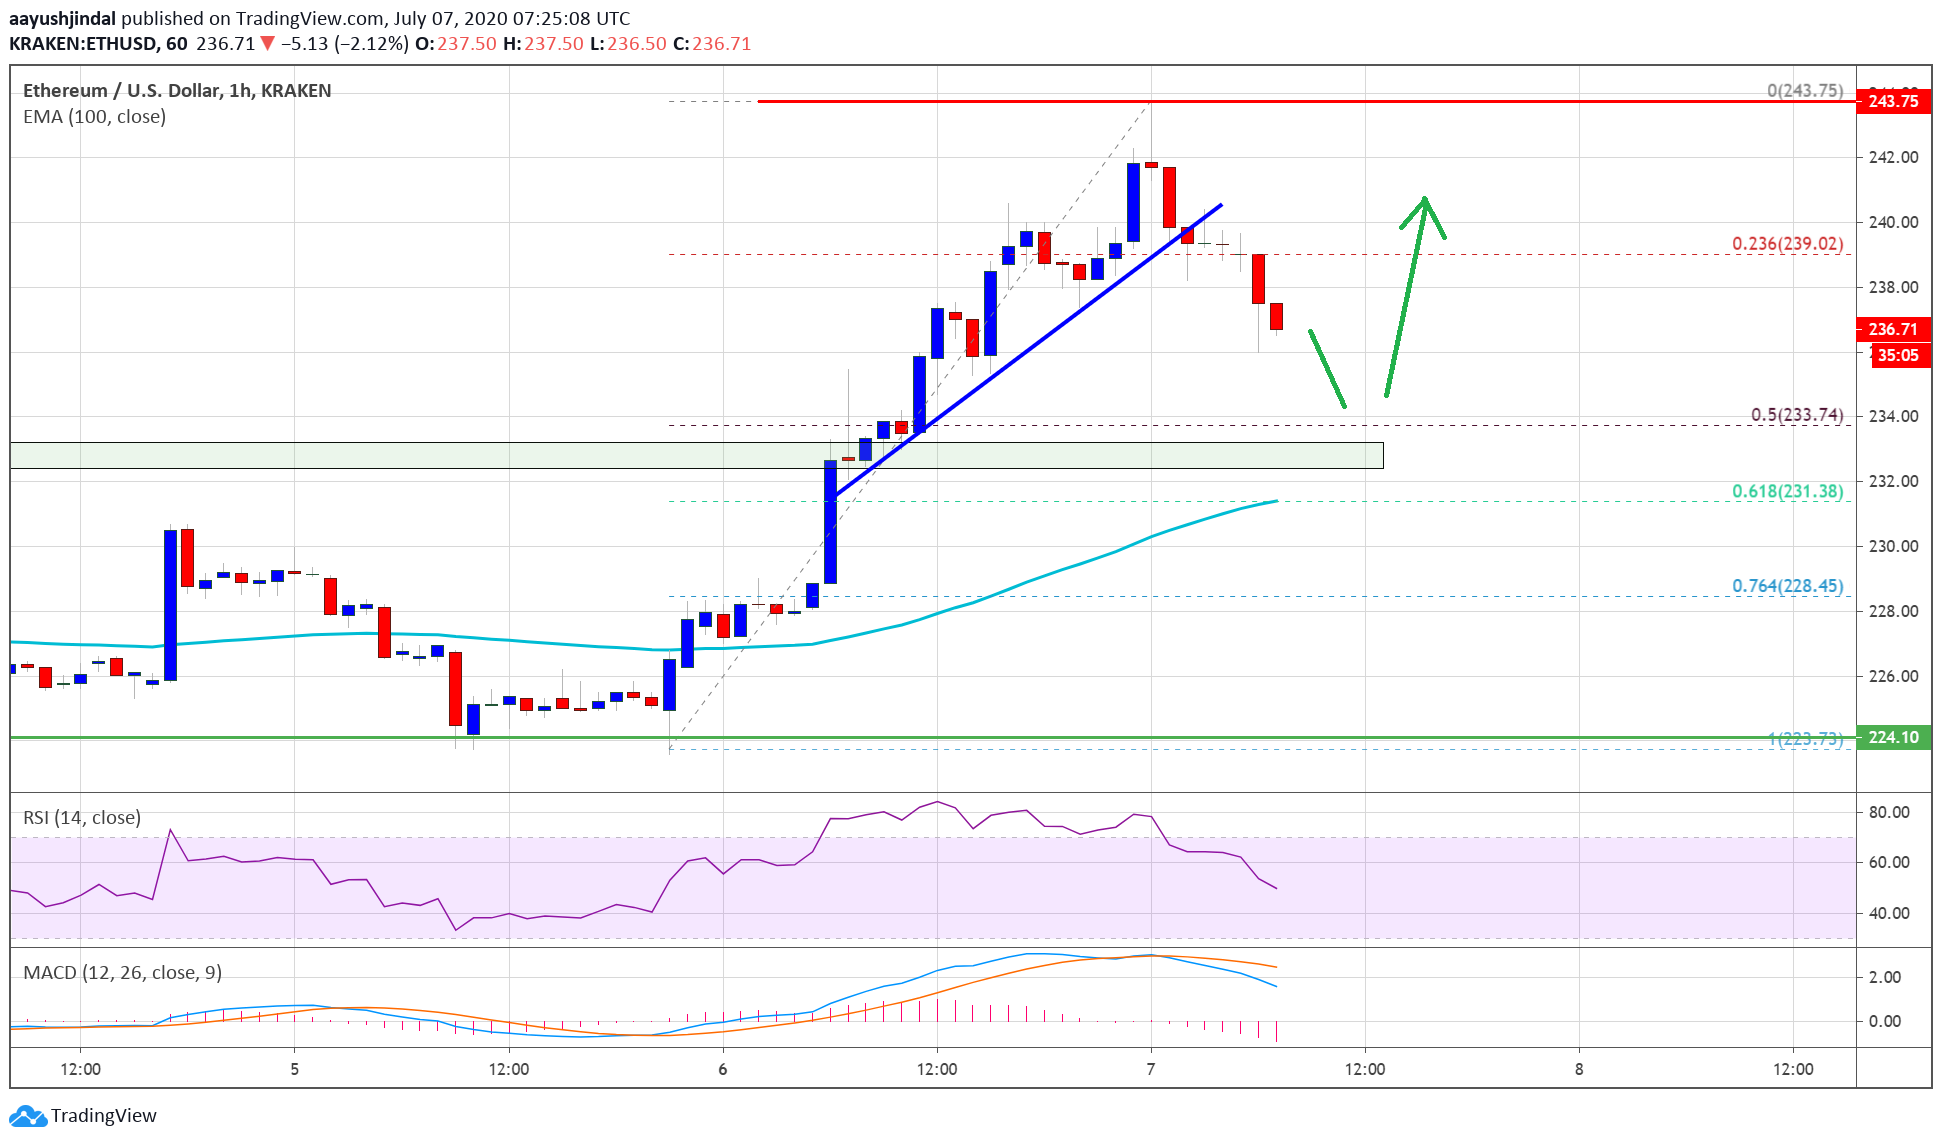
Ethereum price trades below $230. Source: TradingView.com
Ether price is currently declining towards the $235 support level. The first major support is near the $232 level or the 50% Fib retracement level of the recent rally from the $223 swing low to $244 high.
On the upside, the price is likely to face selling interest near the $240 level. A successful break above the $240 and $244 resistance levels could open the doors for a strong rise towards the main $250 barrier in the coming sessions.
Bearish Break in ETH?
On the downside, the $232 region is likely to act as a strong buy zone. The next key support is seen near the $230 level (a significant breakout zone).
If there is a downside break and close below the $230 level, Ethereum is likely to move back into a bearish zone in the near term.
Technical Indicators
Hourly MACD – The MACD for ETH/USD is losing momentum in the bullish zone.
Hourly RSI – The RSI for ETH/USD is currently correcting lower towards the 50 level.
Major Support Level – $232
Major Resistance Level – $240
Take advantage of the trading opportunities with Plus500
Risk disclaimer: 76.4% of retail CFD accounts lose money.