
Ethereum started a downside correction from the $335 swing high against the US Dollar. ETH price is currently approaching a major support zone near $305 and the 100 hourly SMA.
- Ethereum is losing bullish momentum and it is now trading below $320.
- The price is likely to find a strong buying interest near $305 or the 100 hourly simple moving average.
- There was a break below a key ascending channel with support near $318 on the hourly chart of ETH/USD (data feed via Kraken).
- The pair must stay above the $300 handle to resume its upside in the near term.
Ethereum Price Correcting Gains
There was an upside extension above $330 in Ethereum against the US Dollar. ETH price traded to a new monthly high at $335 and the price settled well above the 100 hourly simple moving average.
The price is currently correcting lower and trading below the $325 level. There was a break below the 50% Fib retracement level of the recent upward move from the $307 swing low to $335 high.
Moreover, there was a break below a key ascending channel with support near $318 on the hourly chart of ETH/USD. The pair is now trading below the $320 level, but there are many supports on the downside. An initial support is near the 76.4% Fib retracement level of the recent upward move from the $307 swing low to $335 high.
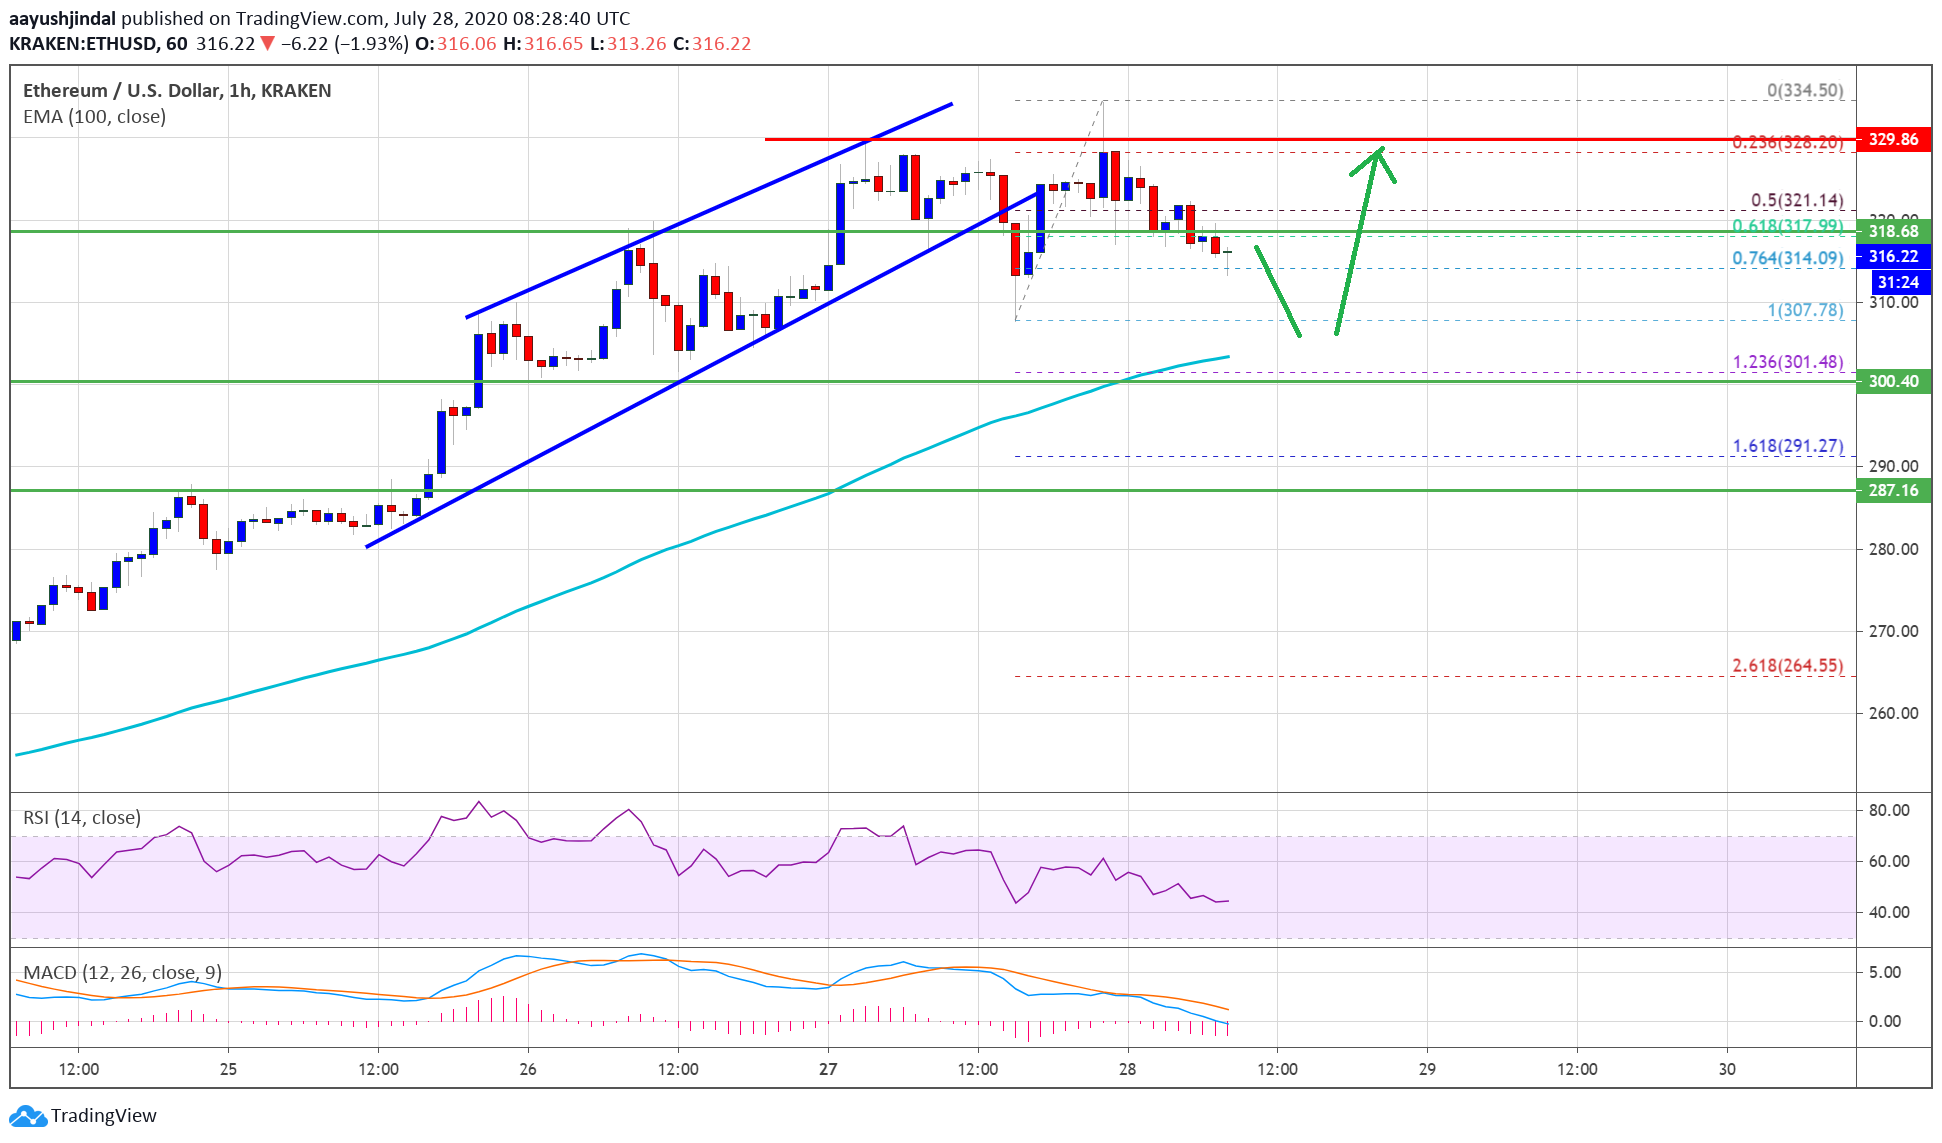
Ethereum price corrects below $320. Source: TradingView.com
The first major support is near the $310 level or the $307 swing low. The main support is seen near the $302 level and the 100 hourly simple moving average.
On the upside, the price could face hurdle near the $322 and $325 levels. A successful break above the $325 resistance could open the doors for a push towards the $335 high or even $345.
Bearish Scenario for ETH
On the downside, ether price is likely to find many supports, starting with $315. The breakdown support is now forming near the $302 and $300 levels, coinciding with the 100 hourly SMA.
If there is a downside break below the $300 level (the pivot zone), the price is likely to decline towards the $285 support zone.
Technical Indicators
Hourly MACD – The MACD for ETH/USD is now gaining pace in the bearish zone.
Hourly RSI – The RSI for ETH/USD is currently sliding below the 50 level.
Major Support Level – $315
Major Resistance Level – $325
Take advantage of the trading opportunities with Plus500
Risk disclaimer: 76.4% of retail CFD accounts lose money.