
Ethereum spiked below the $400 support before recovering higher against the US Dollar. ETH price must surpass the $420 resistance and the 100 hourly SMA to start a fresh increase.
- Ethereum is currently holding the $405 and $400 support levels.
- The price is facing a major barrier near the $420 level and the 100 hourly simple moving average.
- There was a break above a crucial bearish trend line with resistance near $407 on the hourly chart of ETH/USD (data feed via Kraken).
- The pair could start a strong increase if it clears the $418 and $420 resistance levels.
Ethereum Price Testing Breakout Zone
After a sharp decline, Ethereum found support near the $392 level against the US Dollar. ETH started a decent recovery wave and climbed back above the $400 pivot level.
There was a break above the $405 level, but ether price is still below the 100 hourly simple moving average. It managed to recover above the 23.6% Fib retracement level of the downward move from the $447 swing high to $393 low.
Moreover, there was a break above a crucial bearish trend line with resistance near $407 on the hourly chart of ETH/USD. Ethereum is now facing a major barrier near the $420 level and the 100 hourly simple moving average.
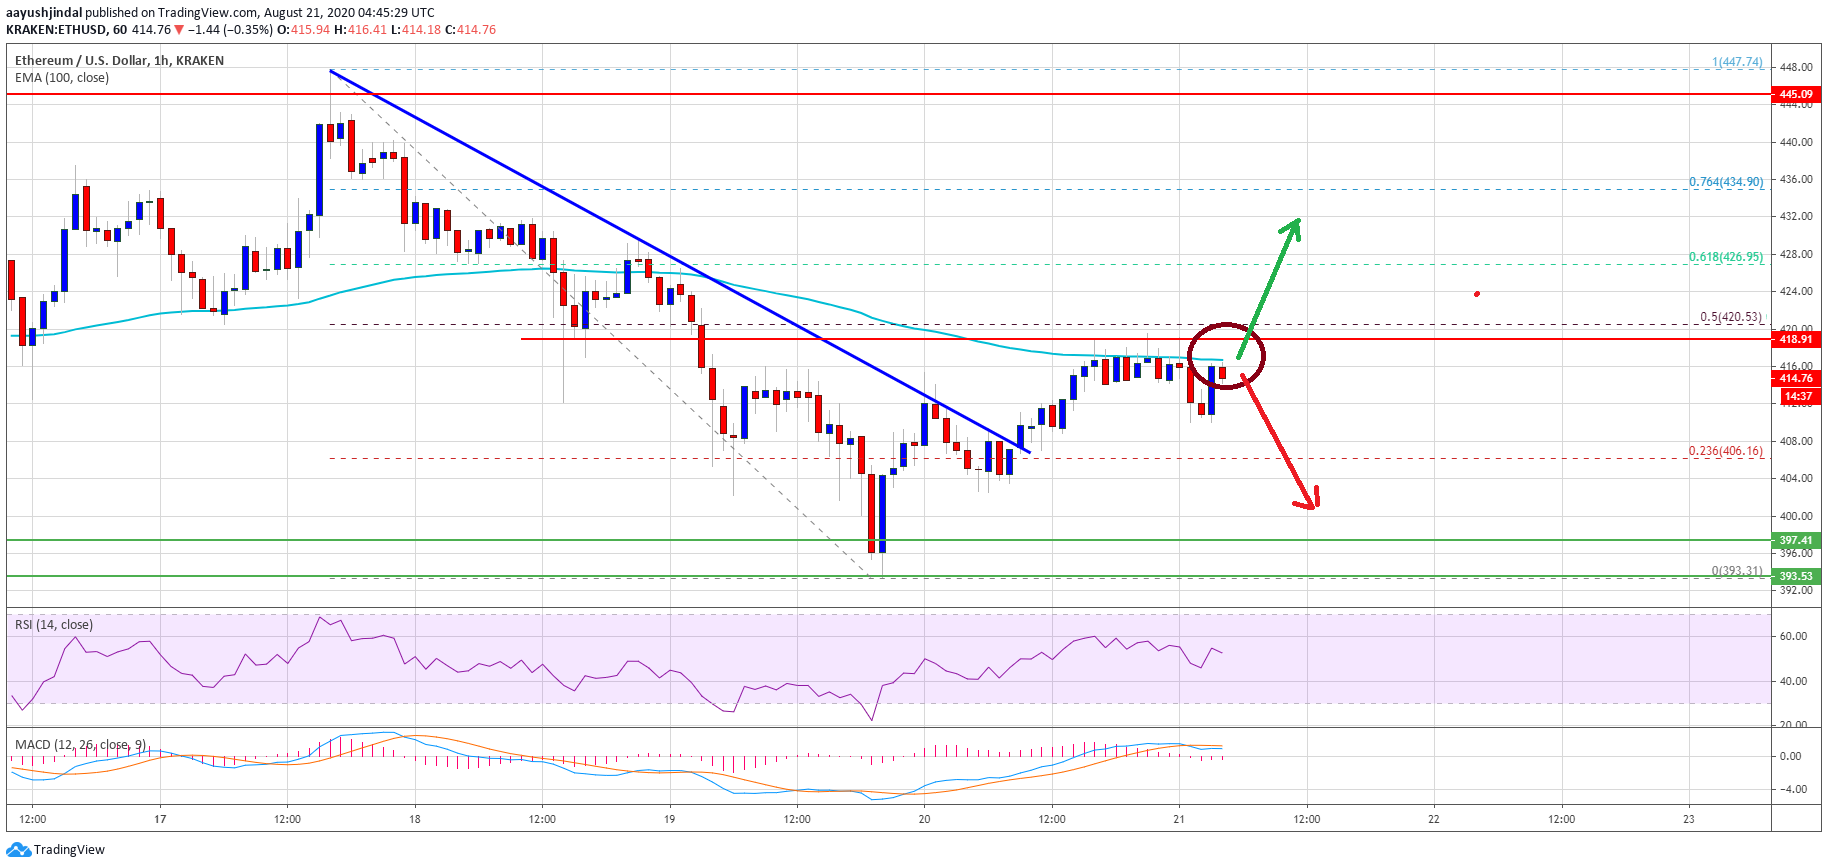
Ethereum price trades above $410. Source: TradingView.com
The 50% Fib retracement level of the downward move from the $447 swing high to $393 low is also acting as a key breakout zone. If there is a successful break above the $418 and $420 resistance levels, the price might start a steady increase.
The next major resistance is near the $426 level, above which the bulls are likely to aim a larger upward move towards the $445 and $450 resistance levels in the coming sessions.
Another Failure for ETH?
If Ethereum fails to recover above $418 or $420, it could resume its decline. An initial support on the downside is near the $408 level. The first major support could be $405, below which the bulls might struggle to protect $400.
A successful close below the $400 support level might start a steady decline. The next support is at $392, followed by the key breakdown zone at $385.
Technical Indicators
Hourly MACD – The MACD for ETH/USD is about to move into the bullish zone.
Hourly RSI – The RSI for ETH/USD is now just above the 50 level.
Major Support Level – $405
Major Resistance Level – $420