
Few cryptocurrencies have had as explosive growth in 2020 as Ethereum has. The top-ranked altcoin led the market into a recovery in early 2020, and after a revisit to an accumulation range, the DeFi trend helped Etheruem rocket out of lows.
However, today was the first sign that Ethereum’s momentum may be waning, as the second-largest crypto by market cap tanked by over 14% in the last 24 hours. Losses have since cooled off to just roughly 7%, but a bearish divergence forming may indicate that there’s more downside ahead.
Ethereum Drops 14%: Bulls Hang Onto Half Of Gains, But Are At Risk Of Losing It All
Overnight last night and into the morning before today’s regular market opening, the always-on crypto market began to correct. Leading the selloff was Bitcoin and Ethereum, each dropping in a violent move.
Ethereum specifically dropped over 14% from yesterday’s high to today’s low. After setting a new 2020 high yesterday at $490, today’s fall left a wick behind down to $420 per ETH token on some exchanges.
The top altcoin is trading back at roughly $440 at the time of this writing, but a massive daily bearish divergence has formed on the Relative Strength Index, which suggests the correction has only just started.
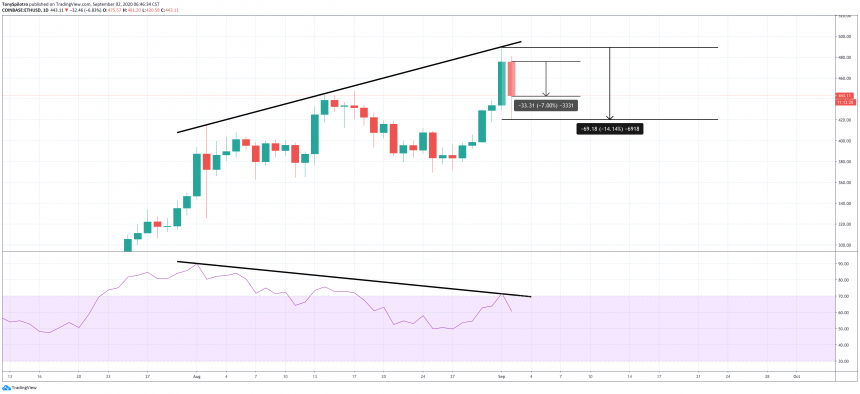
ETHUSD Daily Relative Strength Index Bearish Divergence | Source: TradingView
Top Altcoin Could See Much Deeper Correction, According To Overheated Technical Indicators
According to the Relative Strength Index on daily ETHUSD charts, Ethereum may have a lot more to fall. Ethereum has made a much higher high against the dollar, but the indicator continues to make lower highs. This behavior is called a bearish divergence, and it often forms ahead of a reversal.
Divergences are among the most reliable reversal signals, but they don’t tell you when these reversals will happen. As was seen yesterday, a new high was set before any bearish pressure took over.
But once bears took control, things quickly got out of hand and the correction became violent.
In addition to the divergence on daily timeframes, ETHUSD also triggered a weekly TD 9 sell setup on the TD Sequential indicator with Sunday night’s new weekly open.
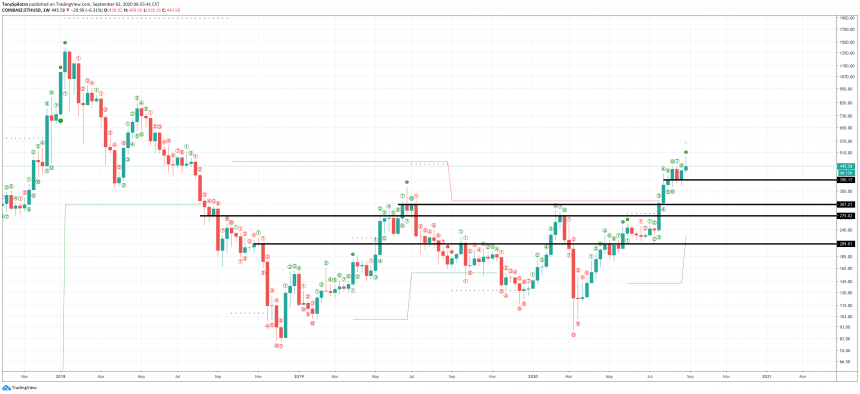
ETHUSD Weekly TD Sequential and Support Levels | Source: TradingView
The chart above shows just how reliable each of these 9 signals has been in the past, calling most of Etheruem’s most pivotal top formations. Coinciding with a bearish divergence makes the signal even more damning for the smart contract focused cryptocurrency.
If the fall does keep going, Ethereum still has support to test at $390 before risking a retest of past highs as resistance turned support. Below $390, targets could reach as low as $300, $275, and $210 approximately.