
The Ethereum (ETH) price has been consolidating inside both a long and short-term range since the beginning of September. Until the price moves outside of this, the direction of the trend remains unclear.
Long-Term Levels
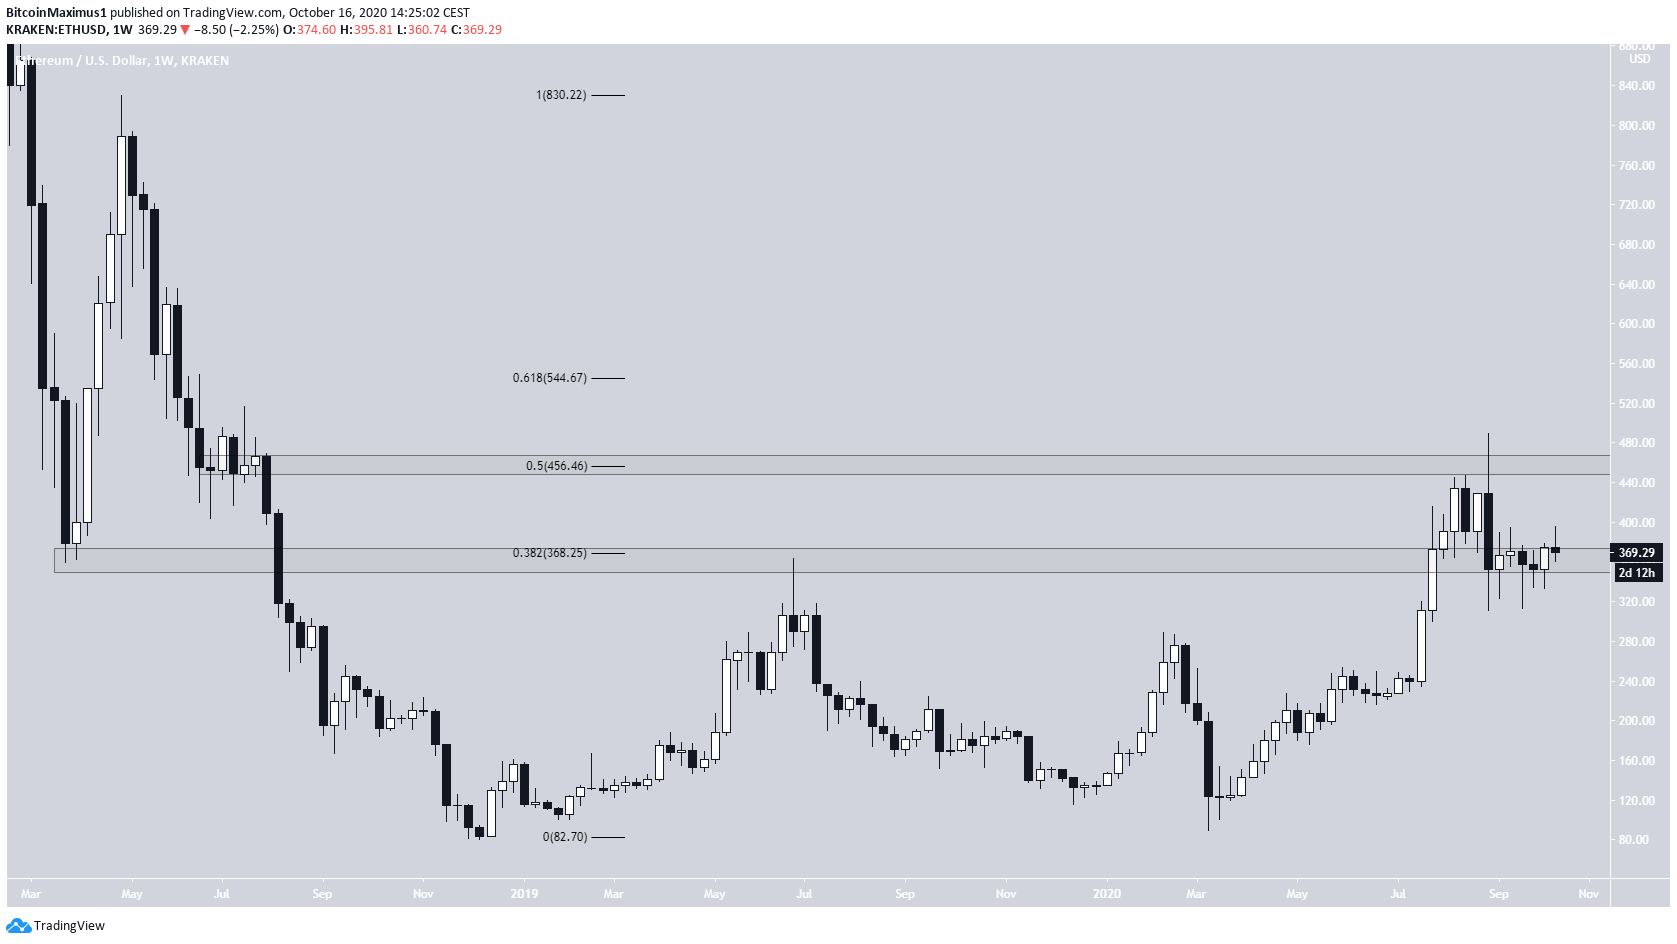
The Ethereum price is currently trading between two important support and resistance levels, found at $370 and $455, respectively. The levels are also the 0.382 – 0.5 Fib levels of the previous downward move.
At the beginning of July, the price broke out from the $370 area and proceeded to reach a high of $489.57 on Sept 1. The price dropped sharply afterward and has now validated the $370 area once more.
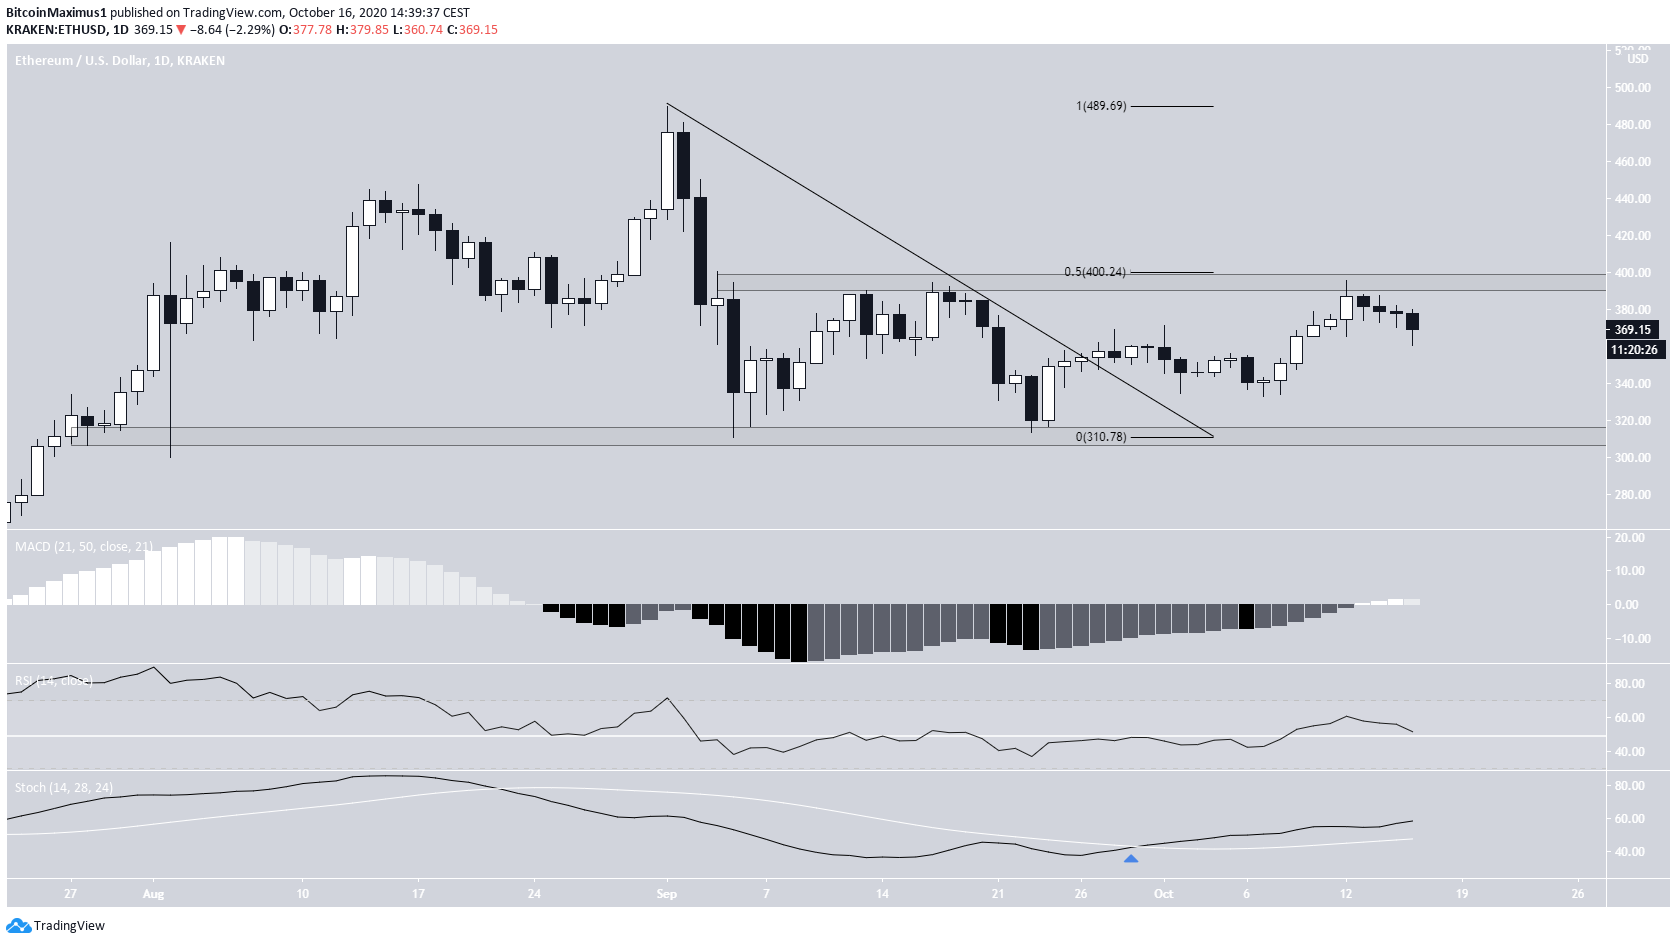
The daily chart shows a similar range, this time between $310 and $395. The latter coincides with the entire fall’s 0.5 fib level and caused a rejection on Oct 12.
Despite this, the price has broken out from a descending resistance line, and technical indicators are bullish. The MACD has even crossed into positive territory.
A breakout above the $395 area would indicate that the trend is bullish and will likely initiate an upward move towards the longer-term resistance area at $455.
Short-Term Movement
Cryptocurrency trader @TradingTank stated that Ethereum is likely to break out from the current descending wedge and head towards $400 and $420.
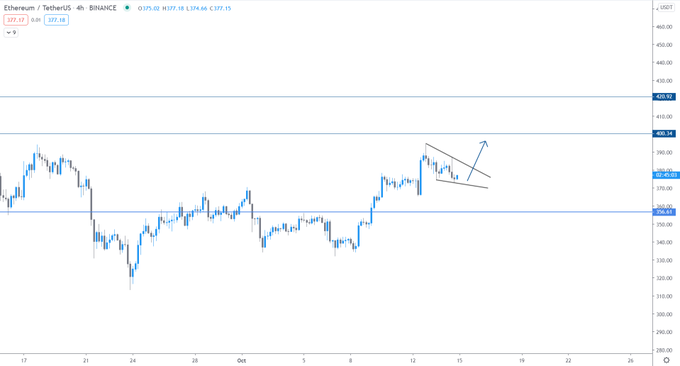
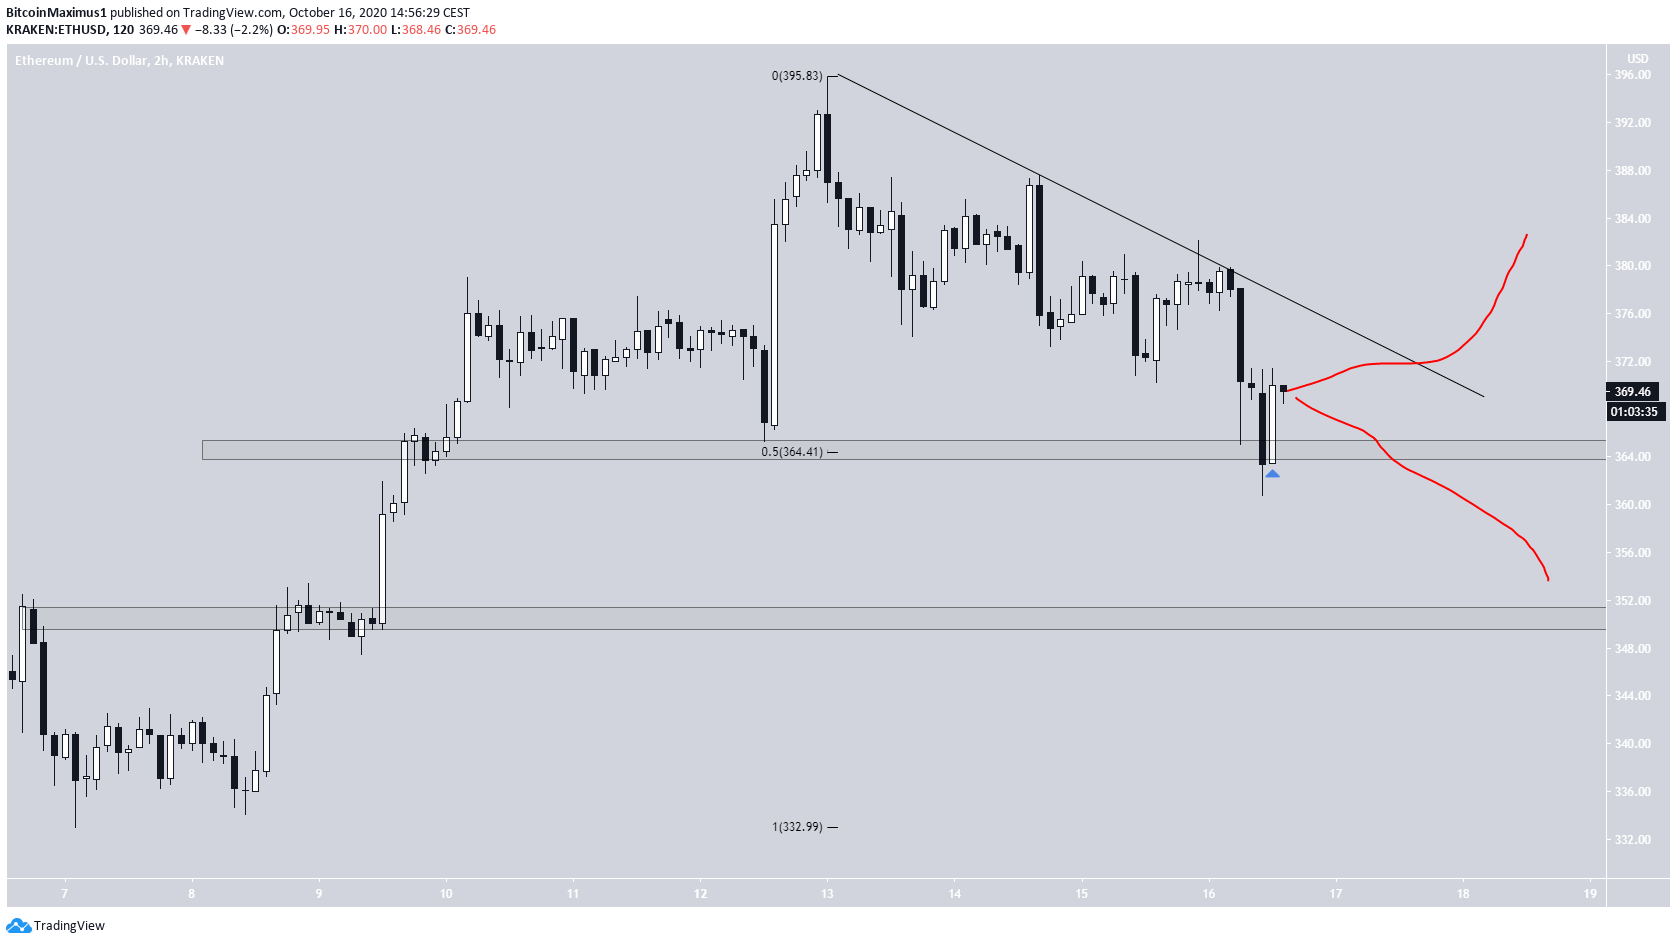
However, since the tweet, the Ethereum price has broken down from the wedge instead. Afterward, the price returned to the 0.5 Fib level of the entire rally and validated it as support, possibly beginning a bounce.
The price is following a short-term descending resistance line. Whether the price breaks down from the 0.5 Fib level or breaks out above the descending resistance line will likely determine the short-term trend.
ETH Wave Counts
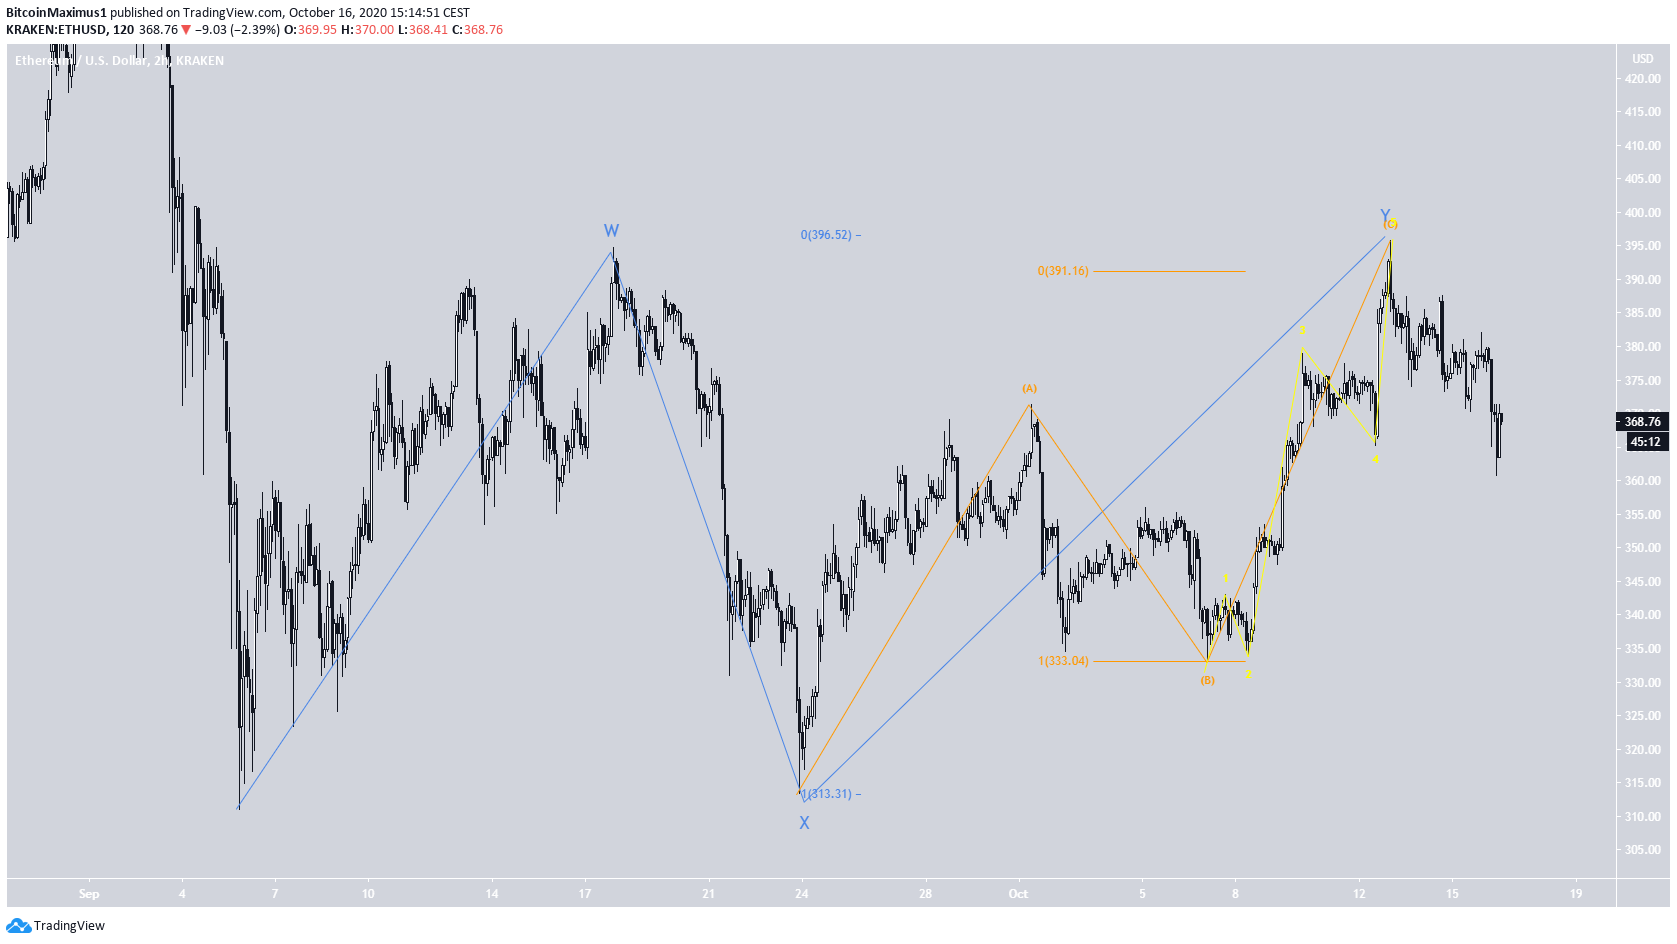
The wave count for Ethereum is not entirely clear. As it stands, it looks as if the move since the Sept 4 low is corrective, possibly being a W-X-Y structure (blue). If so, the price is nearing the end of the C sub-wave (orange) inside the Y wave.
There is strong Fib confluence since both the W:Y and A:C waves have a 1:1 ratio, making this likely the top.
However, sub-wave C can extend all the way to 1.61, the length of A, making a high near $420 possible, which would also fit better with other readings.
On the other hand, a decline below the $323 w2 low would invalidate most bullish formations.
To conclude, while the direction of Ethereum’s trend is not entirely clear due to the lack of a breakout/breakdown, the price action since Sept 4 resembles a corrective structure more than it does an impulsive one.
For BeinCrypto’s Bitcoin analysis, click here.
Disclaimer: Cryptocurrency trading carries a high level of risk and may not be suitable for all investors. The views expressed in this article do not reflect those of BeInCrypto.
The post Ethereum Gets Rejected at $400 – What’s Next? appeared first on BeInCrypto.