
Ethereum is showing positive signs above the $455 support against the US Dollar. ETH price is likely to surge towards $500 if there is a clear break above $500.
- Ethereum is slowly gaining pace above the $450 and $460 levels.
- The price is currently trading nicely above the $460 level the 100 hourly simple moving average.
- There is a major bullish trend line forming with support near $455 on the hourly chart of ETH/USD (data feed via Kraken).
- The pair could accelerate higher if there is a proper close above the $470 resistance.
Ethereum Price is Approaching Breakout
Ethereum remained well bid above the $450 and $455 support levels. ETH price even broke the $460 resistance level and settled well above the 100 hourly simple moving average.
However, the price seems to be facing hurdles near the $468 and $470 levels. A swing high was formed near $468 and the price is currently consolidating gains. An initial support is near the $464 level. It is close to the 23.6% Fib retracement level of the recent increase from the $453 swing low to $468 high.
The first key support is near the $460 level or the 50% Fib retracement level of the recent increase from the $453 swing low to $468 high. More importantly, there is a major bullish trend line forming with support near $455 on the hourly chart of ETH/USD.
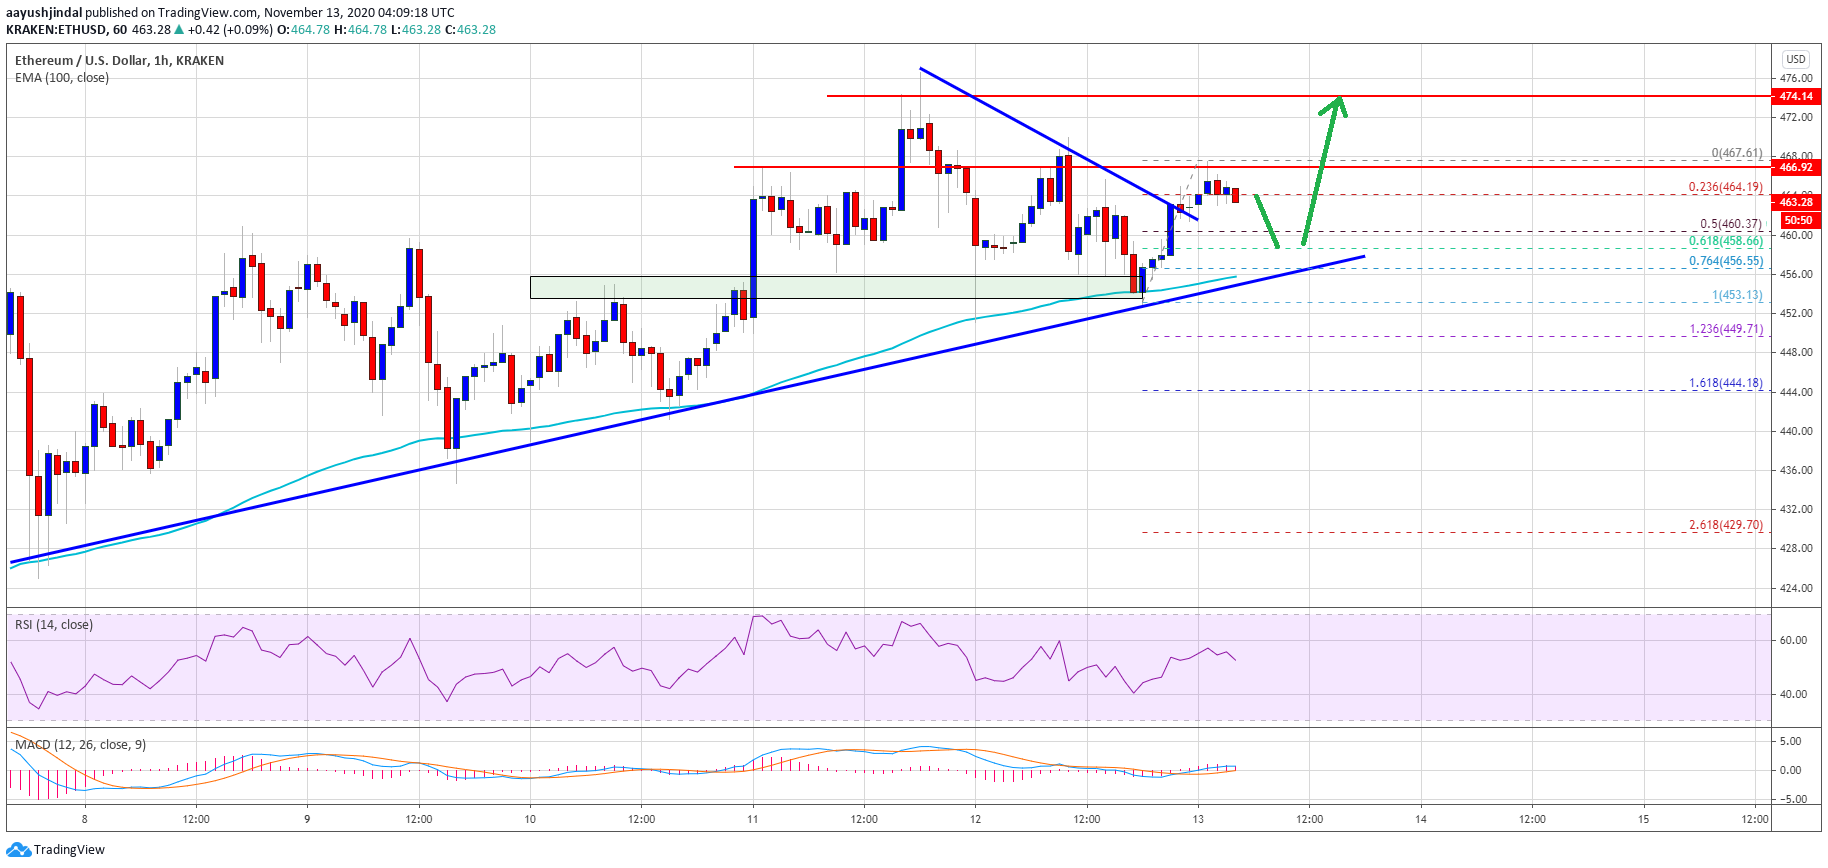
Source: ETHUSD on TradingView.com
On the upside, the $468 zone is a key breakout zone. A successful break above the $468 resistance and a follow up move above the $470 resistance might open the doors for a sharp increase. The next major resistance is near the $480 level, above which ether price is likely to test the $500 handle.
Downsides Limited in ETH?
If there is no upside break above the $470 resistance level, Ethereum might started a corrective decrease. An initial support is near the $460 level.
The main support is now forming near the $455 and $454 levels. The 100 hourly simple moving average is also positioned near the trend line support and $454. Any more losses could trigger a larger decline towards the $435 and $432 support levels in the near term.
Technical Indicators
Hourly MACD – The MACD for ETH/USD is slowly gaining momentum in the bullish zone.
Hourly RSI – The RSI for ETH/USD is now well above the 50 level.
Major Support Level – $454
Major Resistance Level – $470