
Ethereum started a decent upward move above $620 and $630 against the US Dollar. ETH price failed to clear $640 and it is currently struggling to stay above $620.
- Ethereum remained well bid above the $590 zone and recovered above $620.
- The price is now consolidating near $620, but it is below the 100 hourly simple moving average.
- There was a break above a connecting bearish trend line with resistance near $625 on the hourly chart of ETH/USD (data feed via Kraken).
- The pair could slide again if it fails to stay above the $620 support zone.
Ethereum Price is Struggling to Stay above $620
After a downside extension, Ethereum found support near the $590 zone. ETH traded as low as $588 before it started a fresh increase above the $600 pivot level.
The bulls were able to push the price above the $620 resistance level. There was also a break above a connecting bearish trend line with resistance near $625 on the hourly chart of ETH/USD. Ether even surged above the $630 level and the 100 hourly simple moving average.
However, it failed to clear the $638-$640 zone. A high is formed near $639 and the price is currently declining. There was a break below the $630 level and the 100 hourly simple moving average.
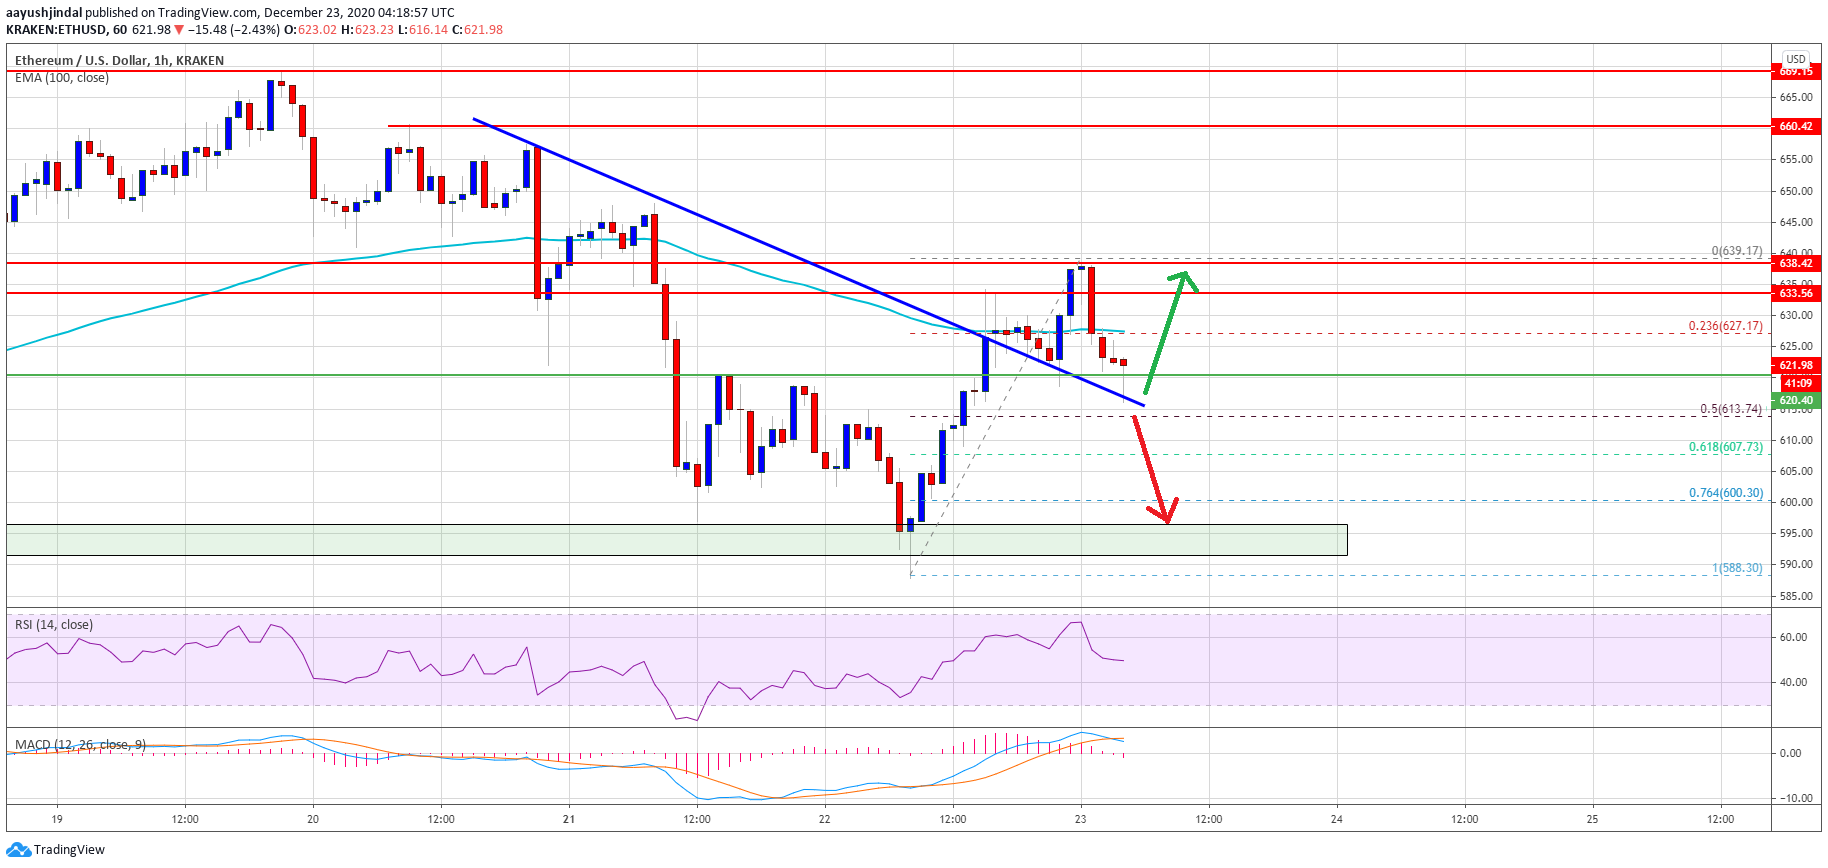
Source: ETHUSD on TradingView.com
The price is trading below the 23.6% Fib retracement level of the recent wave from the $588 low to $639 high. Ether is now trading near the broken trend line and the $620 support. A downside break below $620 might spark another decline.
The next support is near the $612 level or the 50% Fib retracement level of the recent wave from the $588 low to $639 high. Any more losses could lead the price towards the $600 level.
Fresh Increase in ETH?
If ethereum stays above the $620 support level, it could start a fresh increase. An initial resistance on the upside is near the $628 level or the 100 hourly SMA.
The first major resistance is near the $634 level, followed by the $640 zone. A clear break above the $640 zone could open the doors for a sustained upward move towards the $650 and $660 levels.
Technical Indicators
Hourly MACD – The MACD for ETH/USD is slowly moving into the bearish zone.
Hourly RSI – The RSI for ETH/USD is currently close to the 50 level.
Major Support Level – $620
Major Resistance Level – $635