- Ethereum reserves on crypto exchanges have increased by 5.1% since May 18th
- Such an inflow of Ethereum hints of selling by investors
- Ethereum has turned bearish in the short-term
- Ethereum has lost the $2k support and regaining it will be crucial in returning into bullish territory
- Ethereum still has the 200-day MA acting as support at around $1,500
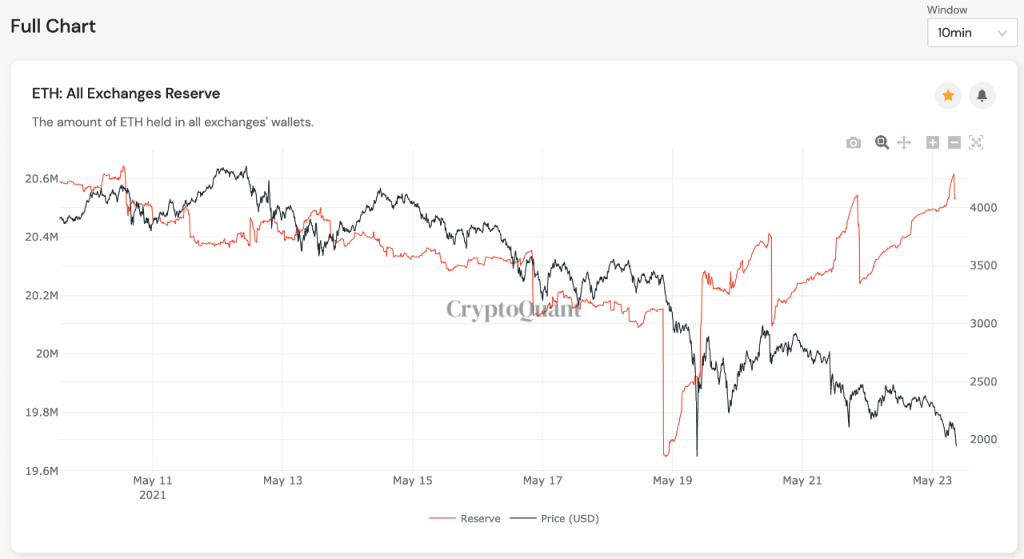
Ethereum held on crypto exchanges has seen a 5.1% increase in less than a week. This is according to an analysis shared by the team at CryptoQuant who also warned that such an inflow of ETH into exchanges, could be a short-term bearish signal as it implies selling by investors. They also shared the following chart demonstrating the increment of Ethereum into crypto exchanges.
Net Flow of Ethereum into Exchanges is Still Negative
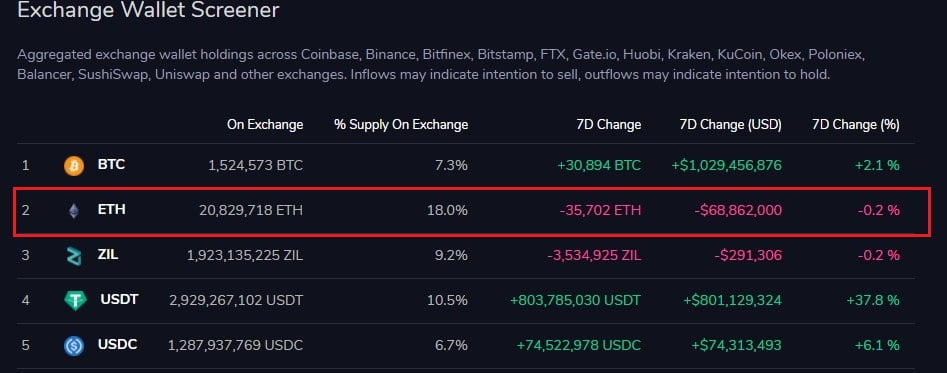
The inflow of Ethereum into crypto exchanges has however not exceeded the outflow of ETH from the same platforms. According to data from Viewbase.com, the amount of Ethereum that has left exchanges in the last week has exceeded that flowing into the same platforms. A screenshot of the net Ethereum flows into and out of exchanges in the last week, can be found below.
Ethereum Still has the 200-Day MA as Support
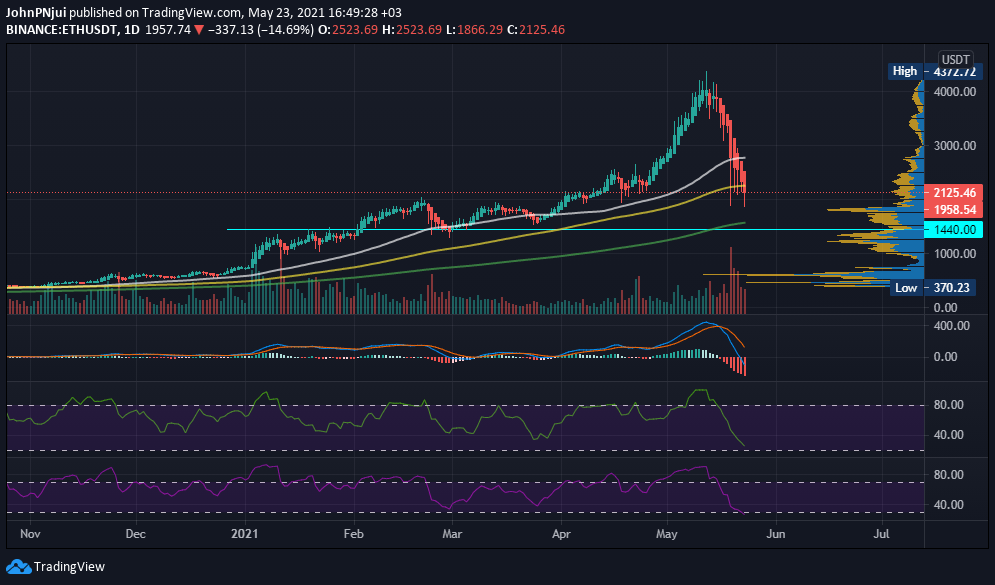
Unlike Bitcoin which has lost its 200-day moving average as support, Ethereum is still trading above this crucial level (green) as seen through the chart below.
Also from the chart, it can be observed that the 200-day moving average converges with the $1,500 support. Below this level is the $1,440 support from Ethereum’s 2018 all-time high value.
With respect to indicators, it can be observed that all three – daily MACD, MFI and RSI – are in oversold territory and hinting at a short-term reversal for Ethereum in the crypto markets.
However, as with all analyses of altcoins such as Ethereum, its fate in the crypto markets is tied to that of Bitcoin. Therefore, if the King of Crypto continues losing support zone after support zone, Ethereum will also follow a similar path to lower levels.


