- Ethereum’s average gas fee has dropped to levels last seen in mid-2020
- It now costs roughly 26.9 GWEI to complete an Ethereum transaction
- Ethereum’s daily transaction count has also dropped to mid-2020 levels
- Ethereum miner revenue has also reached a 3 month low
- All these metrics point towards a drop in network activity on Ethereum that could lead to ETH losing value
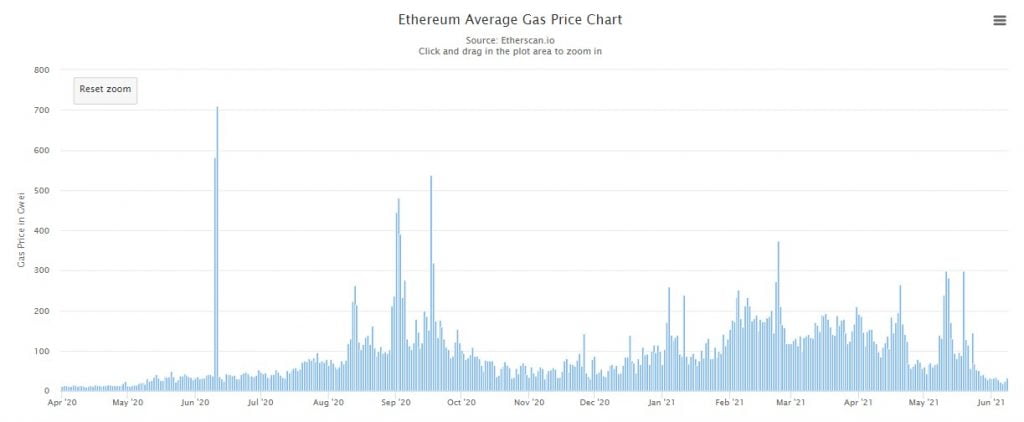
The average gas fee on the Ethereum network has dropped to levels last seen in mid-2020.
According to Glassnode, the average gas fee on the Ethereum network is 26.939 GWEI. A quick glance at Etherscan.io also gives an average gas fee similar to Glassnode at a value of 32 GWEI. Below is a chart courtesy of Etherescan demonstrating the drop in Ethereum’s average gas fees, since mid-May.

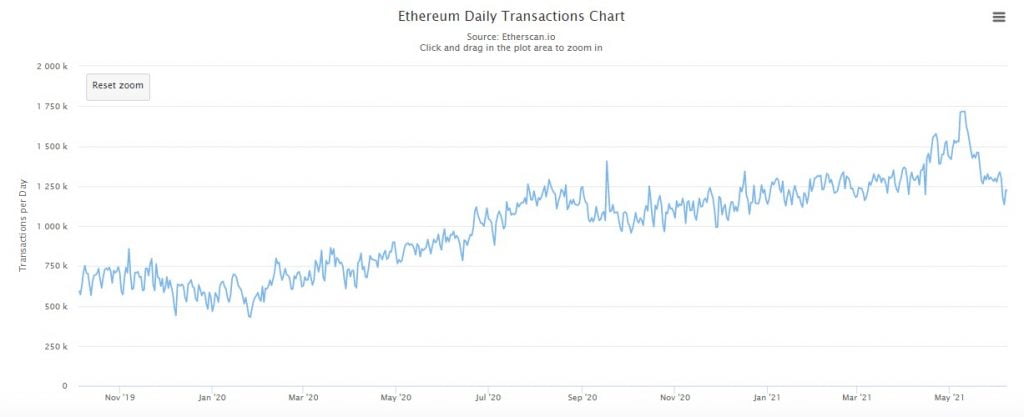
 Ethereum’s Daily Transaction Count Also Drops to mid-2020 Levels
At the same time, the amount of daily transactions on the Ethereum network has dropped to mid-2020 levels as seen in the following chart courtesy of Etherscan.

 Ethereum Miner Revenue Hits a 3 Month Low
The drop in Ethereum’s daily transaction count has resulted in a similar drop in the daily ETH miner revenue which has reached a 3-month low. This milestone was highlighted and shared by the team at Glassnode through the following tweet.
📉 #Ethereum $ETH Miner Revenue just reached a 3-month low of $1,331,258.11
Previous 3-month low of $1,352,393.35 was observed on 30 May 2021
View metric:https://t.co/Wr0bMKQqt8 pic.twitter.com/G8IRmwKYZe
— glassnode alerts (@glassnodealerts) June 9, 2021
Capitulation Might be Next By Ethereum Hodlers
The metrics shared above linked to Ethereum, point towards an ongoing drop in network activity as illustrated with the decreasing gas fees, daily transaction count and ETH miner revenue.
Such a continual drop in network activity affects demand for ETH which ultimately affects its value. It also increases the probability of Ethereum investors capitulating given the fact that they already have a negative sentiment towards ETH right now.
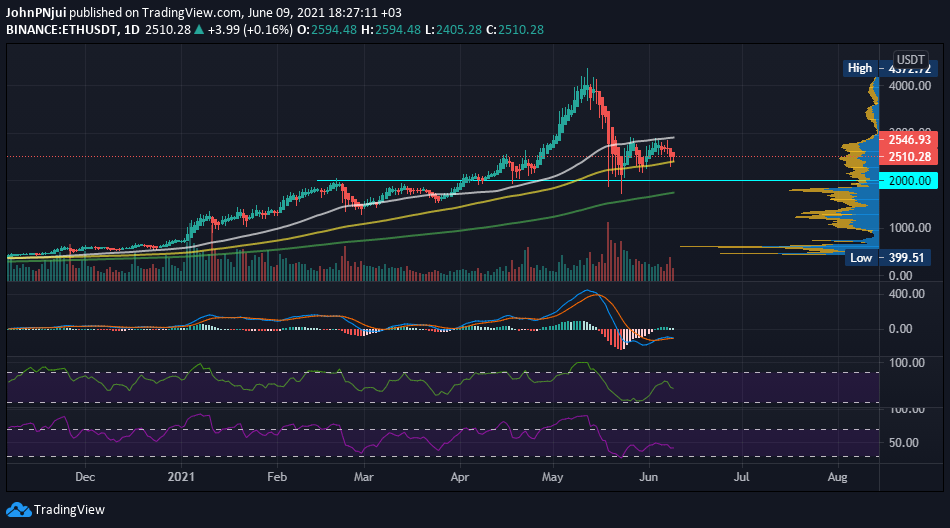
With respect to price action, Ethereum is currently trading at $2,550 after yesterday’s drop to the $2,300 support. To note is that Ethereum’s $2,300 to $2,500 support zone coincides with the 100-day moving average (yellow) as seen in the chart below.
In addition, the 50-day moving average (white) converges with the $2,800 resistance zone. Therefore a breakout above the 50-day MA would confirm increased buying and a potential return to bullish territory. Conversely, a breakdown below the 100-day MA would open the doors to more losses to the 200-day MA at the $1,800 price area.

