
Ethereum started a decent increase above the $2,920 resistance against the US Dollar. ETH must clear $2,980 and $3,000 to continue higher in the near term.
- Ethereum started a steady recovery wave above the $2,900 resistance.
- The price is now trading above $2,900 and the 100 hourly simple moving average.
- There is a major bullish trend line forming with support near $2,900 on the hourly chart of ETH/USD (data feed via Kraken).
- The pair must clear the $2,980 and $3,000 resistance levels to continue higher.
Ethereum Price Starts Recovery
Ethereum formed a base above the $2,760 level and started a steady increase. ETH climbed above the $2,850 and $2,880 resistance levels to move into a positive zone.
Ether even surged above the $2,900 level and the 100 hourly simple moving average. Finally, there was a spike above the $2,950 level and the price traded as high as $2,969. It is now consolidating gains below the $2,980 resistance zone.
It is trading above the 23.6% Fib retracement level of the recent wave from the $2,756 swing low to $2,969 high. There is also a major bullish trend line forming with support near $2,900 on the hourly chart of ETH/USD. On the upside, an initial resistance is seen near the $2,970 level.
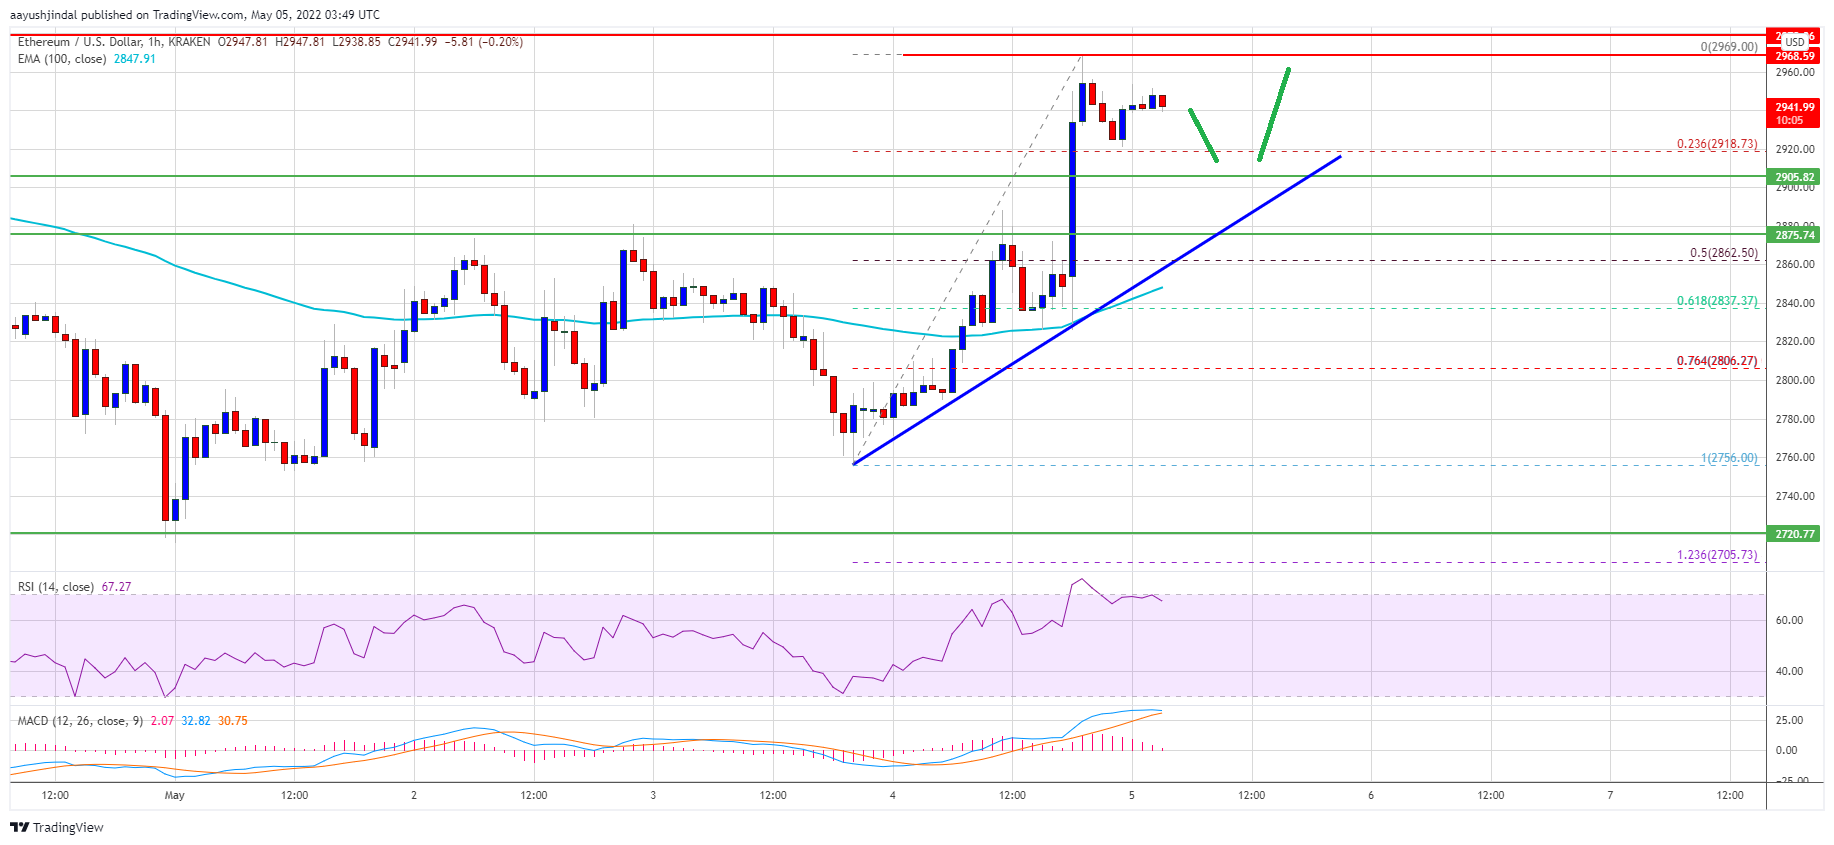
Source: ETHUSD on TradingView.com
The first major resistance is near the $2,980 level. The main breakout zone is now near the $3,000 level. A close above the $3,000 level could set the tone for a larger increase. In the stated case, ether price might rise towards the $3,150 resistance.
Dips Supported in ETH?
If ethereum fails to gain pace above the $2,980 resistance, it could start a downside correction. An initial support on the downside is near the $2,920 zone. The next major support is near the $2,900 level and the trend line.
If there is a downside break below the trend line support, ether price might test the 50% Fib retracement level of the recent wave from the $2,756 swing low to $2,969 high. Any more losses might call for a test of the $2,850 support and the 100 hourly simple moving average.
Technical Indicators
Hourly MACD – The MACD for ETH/USD is still showing positive signs in the bullish zone.
Hourly RSI – The RSI for ETH/USD is correcting from the 80 level.
Major Support Level – $2,900
Major Resistance Level – $2,980