Ethereum has been experiencing a slowdown in its bullish momentum over the weekend. The cryptocurrency managed to break the critical resistance at $1,700 but could re-test previous support levels before reclaiming higher levels.
According to Wu Blockchain, Ethereum recently surpassed Bitcoin in terms of Open Interest (OI) for options contracts. This metric stands at $5.6 billion as opposed to BTC’s $4.3 billion.
For the first time since the inception of these products, ETH’s price beat BTC’s open interest. As Wu Blockchain noted, most of the OI recorded for Ethereum option contracts are calls (buy) concentrated on September 30 and December 30.

Both of these dates are post-merge, a highly expected event for Ethereum. “The Merge” has been tentatively set for mainnet by September 9th.
This event will complete ETH migration from a Proof-of-Work (PoW) consensus to a Proof-of-Stake (PoS) consensus. Players in the options market seem to be positioned to the upside or hedging potentially short positions with other investment products.

A Different Perspective On The Price Of Ethereum
Data from Material Indicators accurately predicted the short-term selling pressure with the potential for an increase in volatility on yesterday’s essential daily, weekly, and monthly candle close. These events often promote sudden moves in an asset’s price.

As seen below, Material Indicators’ Trend Precognition Indicator flashed a short signal at yesterday’s daily close. This suggested that Ethereum had a high chance of trending to the downside.
This short-term selling pressure coincided with technical resistance at the 100-day moving average (DMA). This level swelled with an increase in asks orders as the price of Ethereum trended to the upside over the past two days.
At the time of writing, ETH’s price still records $13 million in asks (sell) orders at $1,700. This suggests that this level will continue to operate as critical resistance for the time being.
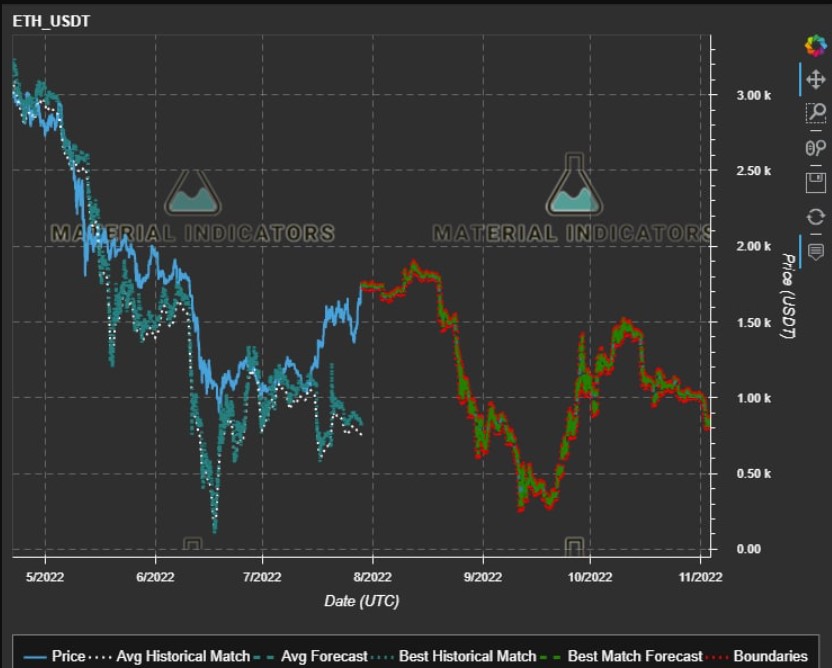
This shift in momentum for ETH’s price, as supported by Material Indicator’s trend precognition and asks liquidity, might translate into more persistent downside price action. As seen below, these analysts presented a possible bearish scenario for Ethereum for the coming months.
The fractal or price forecast below shows ETH’s price might trend downwards until at least October 2022. These models are highly unpredictable but it could provide traders with clarity about the price direction in high time frames.
On the latter, analysts from Material Indicators said the following highlighting how this data provides a different take on the current ETH’s price narrative away from the migration to a PoS consensus:
I don’t recommend trading fractals or taking them too literally as they can deviate in both price range and time or invalidate anytime. That said… All of the above elements paint a very compelling story for #ETH based purely on algos and TA without any of the POW (Proof-of-Work) –> POS (Proof-of-Stake) chatter