Disclaimer: The findings of the following analysis are the sole opinions of the writer and should not be considered investment advice.
- Ethereum’s recent decline below its long-term trendline resistance exhibited an increased selling edge.
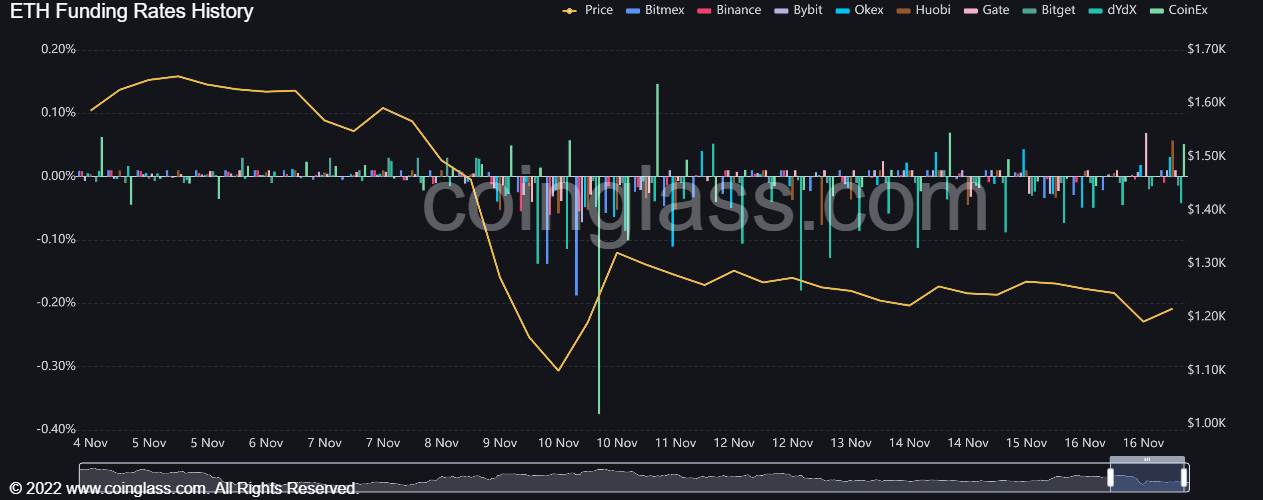
- The altcoin noted a gradual improvement in its funding rates over the past day.
Ethereum [ETH] witnessed double-digit losses over the last 12 days after reversing from the $1,650 resistance level. The resulting pulldown chalked a reversal pattern in the daily chart.
Read Ethereum’s Price Prediction 2023-24
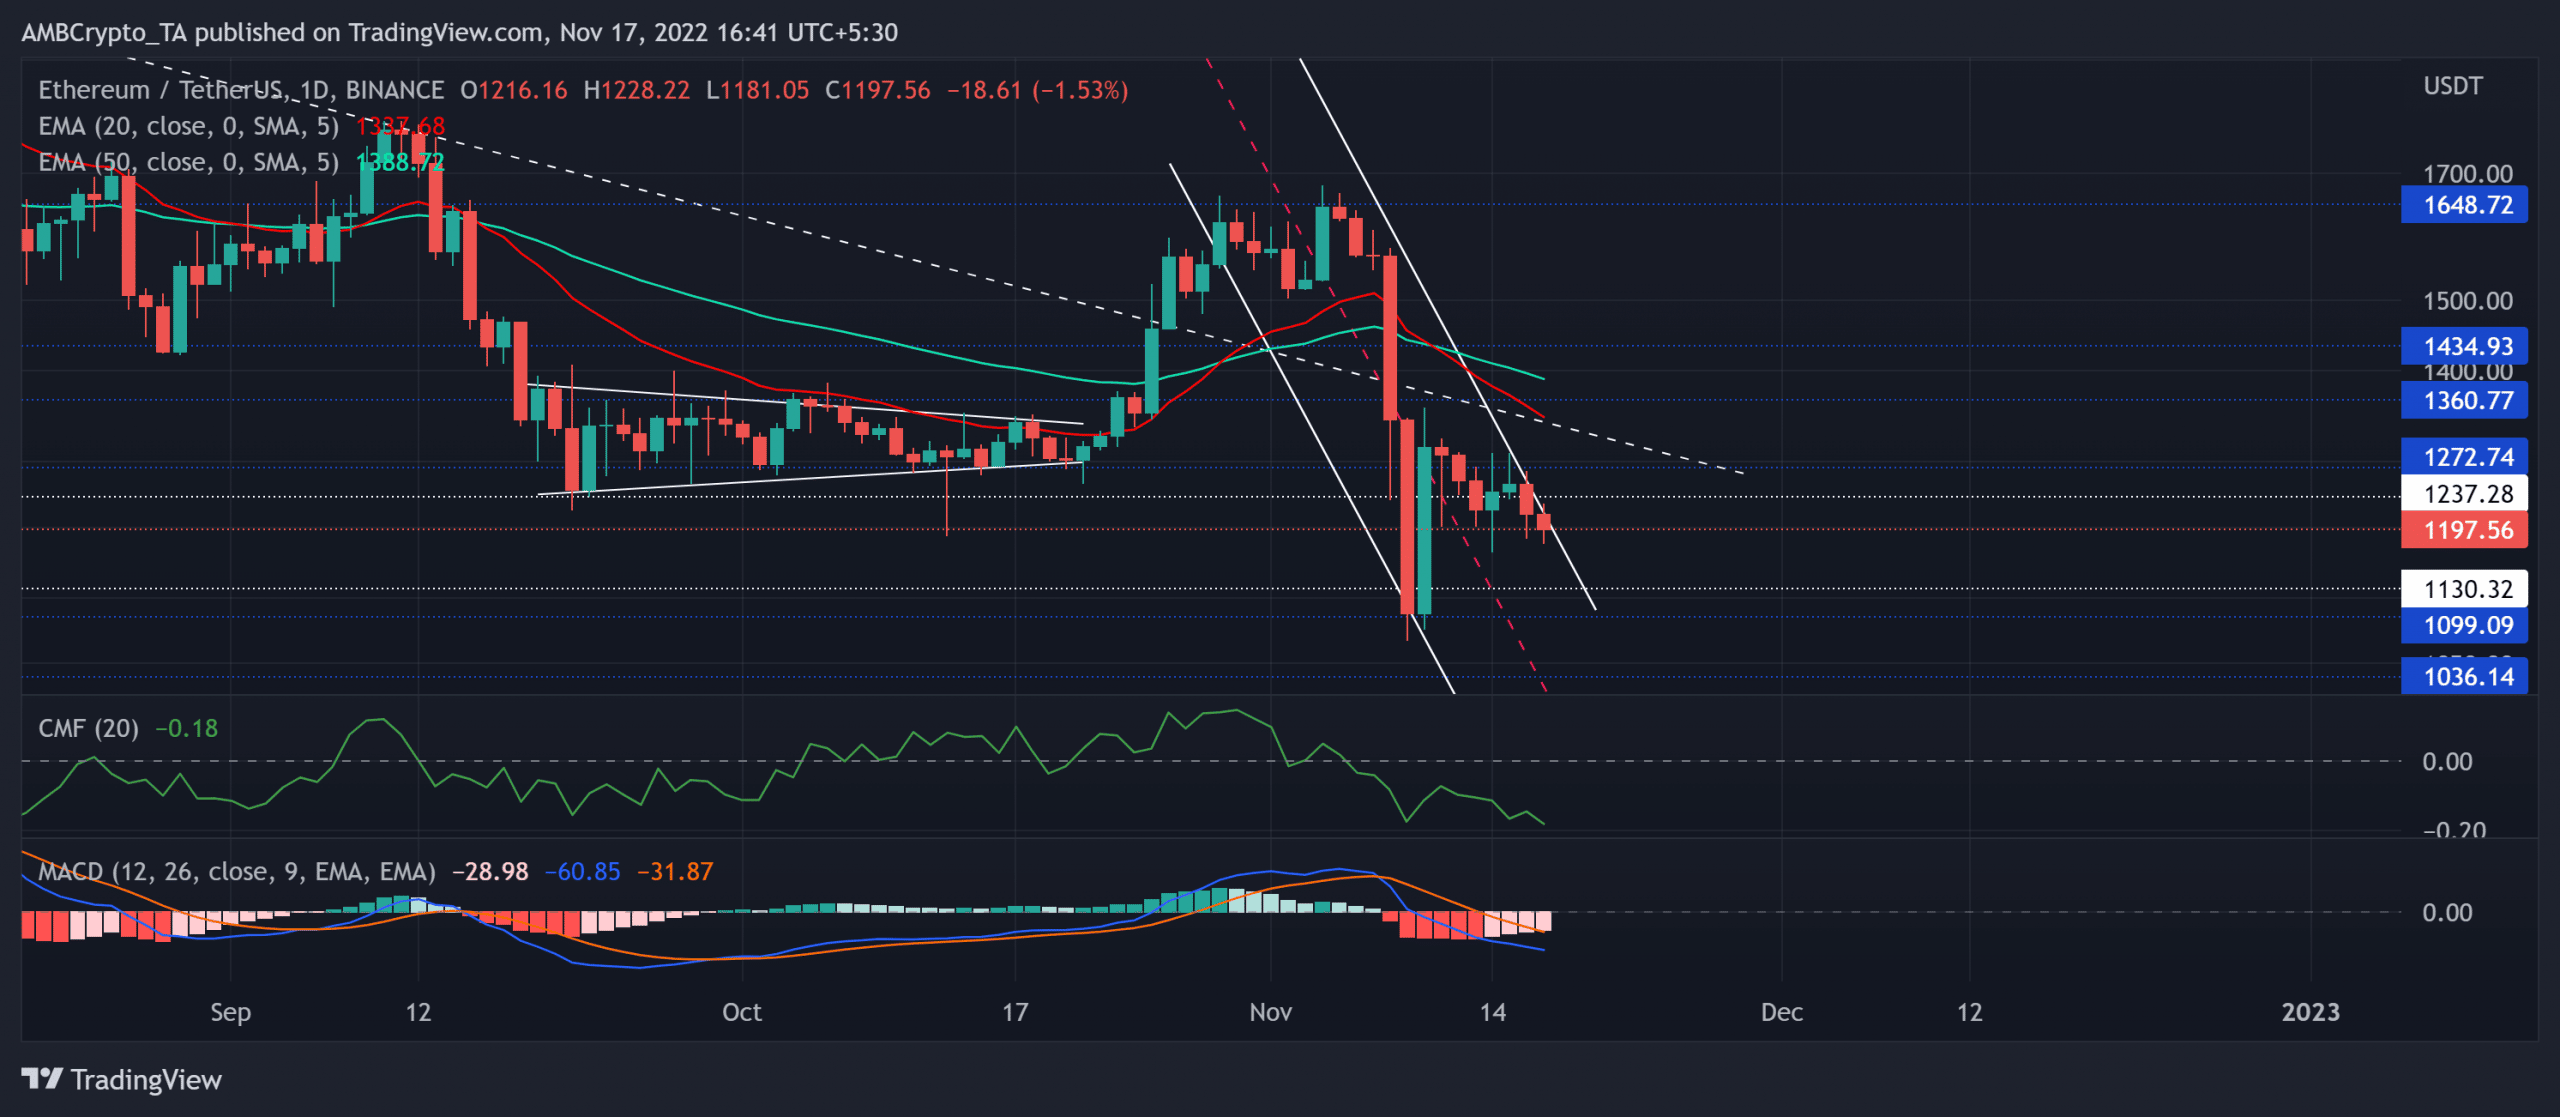
Should the sellers continue their rebound rally from its immediate resistance, ETH could see an extended fall before a bullish rebuttal. At press time, the alt was trading at $1,197.56, down by 3.18% in the last 24 hours.
Can the buyers step in to stop the bleeding?
ETH bears have consistently shown their will to curtail the buying rallies near the trendline resistance (white, dashed) for over seven months.
To top it up, the $1,648 ceiling undermined the recent jump above this trendline by reigniting the bearish pressure. Consequently, ETH fell below the limitations of its 20 EMA (red) and the 50 EMA (cyan).
The recent price movements chalked out a descending channel structure in the daily timeframe. Furthermore, should the upper trendline of the down channel continue to pose hurdles, ETH could see an extended decline. In such a case, the $1,050-$1,100 region could continue supporting rebounds.
On the other hand, an immediate revival above the pattern could affirm a near-term bullish resurgence. The first major resistance level for the buyers would lie near the trendline resistance and the 20 EMA near the $1,337 region.
The Chaikin Money Flow (CMF) dipped below the zero mark to reveal an increased selling edge. Also, the Moving Average Convergence Divergence (MACD)’s decline below the zero mark hinted at a shift in the broader momentum toward the sellers. Nonetheless, any recoveries on the CMF can affirm a bullish divergence in the coming times.
Funding rate analysis
According to data from Coinglass, ETH’s funding rates across most exchanges inclined toward the positive side after marking slight improvements over the past few days.
But its rate on Binance was yet to find a convincing close above the zero level. Finally, investors/traders must watch out for Bitcoin’s [BTC] movement. This is because ETH shared a staggering 92% 30-day correlation with the king coin.


